neighborhood.fyi Blog
What Listing Sites Don't Show You About a Neighborhood
neighborhood.fyi maps the flood zone, freeway noise, school boundary, crime and nearby hazards that a real estate listing leaves out.
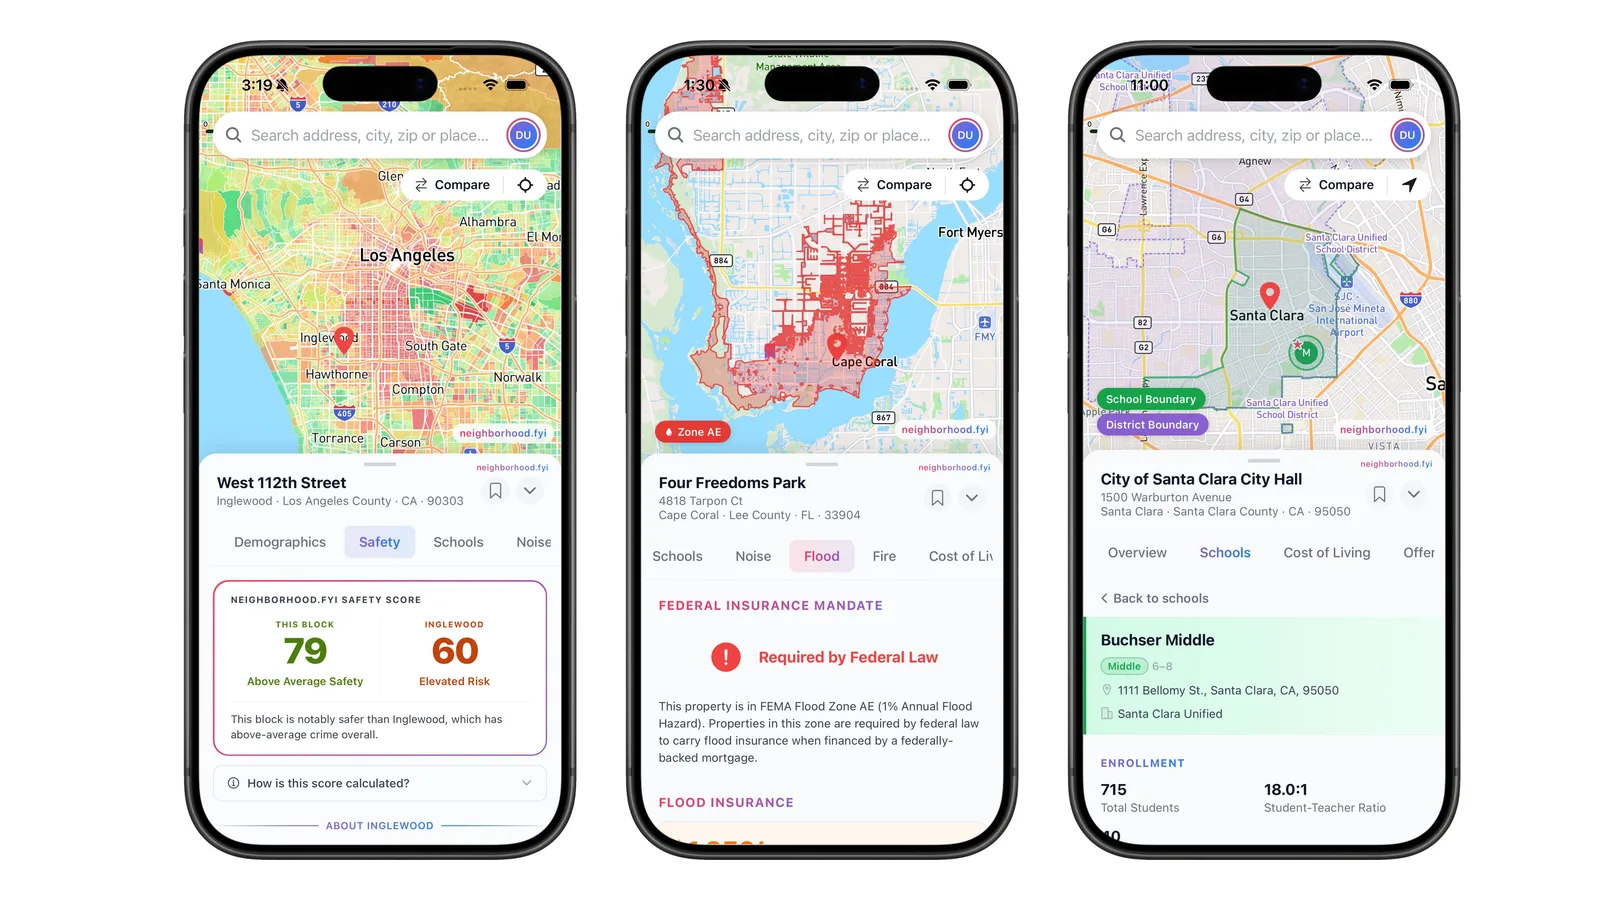
A listing tells you the price, the square footage, the number of bedrooms and the year the roof was replaced. It tells you almost nothing about the block. neighborhood.fyi is an iPhone app that fills in the rest: the flood zone and its claims history, the school your address is actually zoned for, how safe the block is compared to the city around it, how loud the road is, and which regulated sites sit within a few miles.
Everything comes from public federal, state and local data. You search an address, and each layer appears on the map and in a panel below it.
The listing stops at the property line
Most of what makes a home good or bad to live in is outside the property. A quiet street two blocks from a rail corridor. A well-reviewed elementary school that the address is not zoned for. A flood zone that triggers a federal insurance requirement. A closed landfill behind a screen of trees.
This information exists, and almost all of it is public. The problem is that it is spread across FEMA, the EPA, the FBI, the Census Bureau, NCES, CAL FIRE, the Department of Transportation and dozens of state agencies, in formats built for analysts rather than buyers. Checking one address properly across all of them takes hours. Checking five is not realistic.
neighborhood.fyi does that work in advance and puts the answers on one map.
Safety, measured against the surrounding city
A crime number on its own is hard to read. Two hundred incidents a year means one thing in a dense city and something else in a small town.
So the app shows two scores side by side: one for the block, one for the city or place around it. A block that scores 79 inside a city that scores 60 is notably safer than its surroundings, and the app says so in those words. That comparison is usually the thing you actually want to know.
The underlying counts come from FBI Uniform Crime Reporting data, aggregated by geography. The app also shows registered sex offenders near an address, from the National Sex Offender Public Website, with counts by distance and a profile view for each record.
The school your address is zoned for, not the one nearby
“Nearby schools” is a misleading measure. What matters is the attendance boundary the address falls inside.
The app draws school attendance boundaries and district boundaries, so you can see whether an address is inside a given zone rather than guessing from distance. Coverage is good but not complete: about 74% of public schools in the app have a mapped attendance boundary. Charter schools generally have none, because most do not draw zones at all.
For schools that have them, the app also shows test results: proficiency rates in English, math and science, from state assessment data.
Flood and fire risk, with the insurance record attached
The app shows FEMA National Flood Hazard Layer zones, and it labels what a zone means in practice. An address in Zone AE is in the 1% annual chance floodplain, and a federally backed mortgage on it requires flood insurance by law. That is a cost, not a footnote.
Alongside the zone, the app shows National Flood Insurance Program data for the area, including the claims that have actually been paid there. A zone map tells you the modelled risk. The claims history tells you what has already happened.
Fire works the same way. The app shows fire hazard severity zones and wildfire risk to communities, and in California it includes FAIR Plan data, which is the state’s insurer of last resort. If ordinary coverage is hard to get in an area, that shows up.
Noise you will not hear on a Sunday afternoon
A viewing happens at one moment on one day. Traffic noise does not.
The app maps modelled noise from roads, railways and aircraft, using Department of Transportation, FAA and FRA data, and breaks down which source is responsible. A block can be quiet at midday and sit under an approach path at 6 a.m.
What is nearby that nobody advertises
Several layers cover the things a seller has no reason to mention:
- EPA sites: Superfund and National Priorities List sites, Toxics Release Inventory facilities and RCRA hazardous waste sites
- Odor sources: landfills, wastewater treatment plants and tidal wetlands
- Power and pipelines: high-voltage transmission lines, and natural gas, crude oil and petroleum product pipelines
Each one shows the site on the map with a detail view, so you can tell the difference between an active facility and a closed one that was cleaned up thirty years ago.
Who lives here, and what it costs
The app includes Census American Community Survey data on age, race, gender and education, and cost-of-living measures including home values, household income and the age of the housing stock. Both can be viewed as heatmaps, which is usually the fastest way to see where a boundary in a city actually falls.
Comparing a shortlist
You can save homes and then compare them side by side, metric by metric, in one table. Most people do not evaluate one address in isolation. They are choosing between three or four, and the useful question is which one is worse on the things they care about.
What is free
Every layer is visible without paying. The free tier shows the section summaries and the counts: the safety scores, the flood and fire zone labels, school names and distances, demographic and cost figures, and how many EPA sites are nearby. You can save up to three homes.
Premium is $4.99 per month. It unlocks the map heatmaps and overlays, the full lists and detail views behind each count, school ratings and test scores, unlimited saved homes and side-by-side compare.
If someone shares a referral code with you, redeeming it gives you a free 7-day pass to everything.
Who it is for
The app is built for people choosing between specific addresses:
- Buyers with a shortlist who want to know which one carries a risk they had not priced in
- Anyone relocating to a metro they do not know, where local knowledge is not available
- Renters who want to check a block before signing a year-long lease
It is not a valuation tool and it does not predict prices. It answers a narrower question: what is true about this block that the listing did not say.
Check a block before you commit to it
Safety, schools, flood and fire zones, noise and what is nearby — on a map, for any address.
Get the app