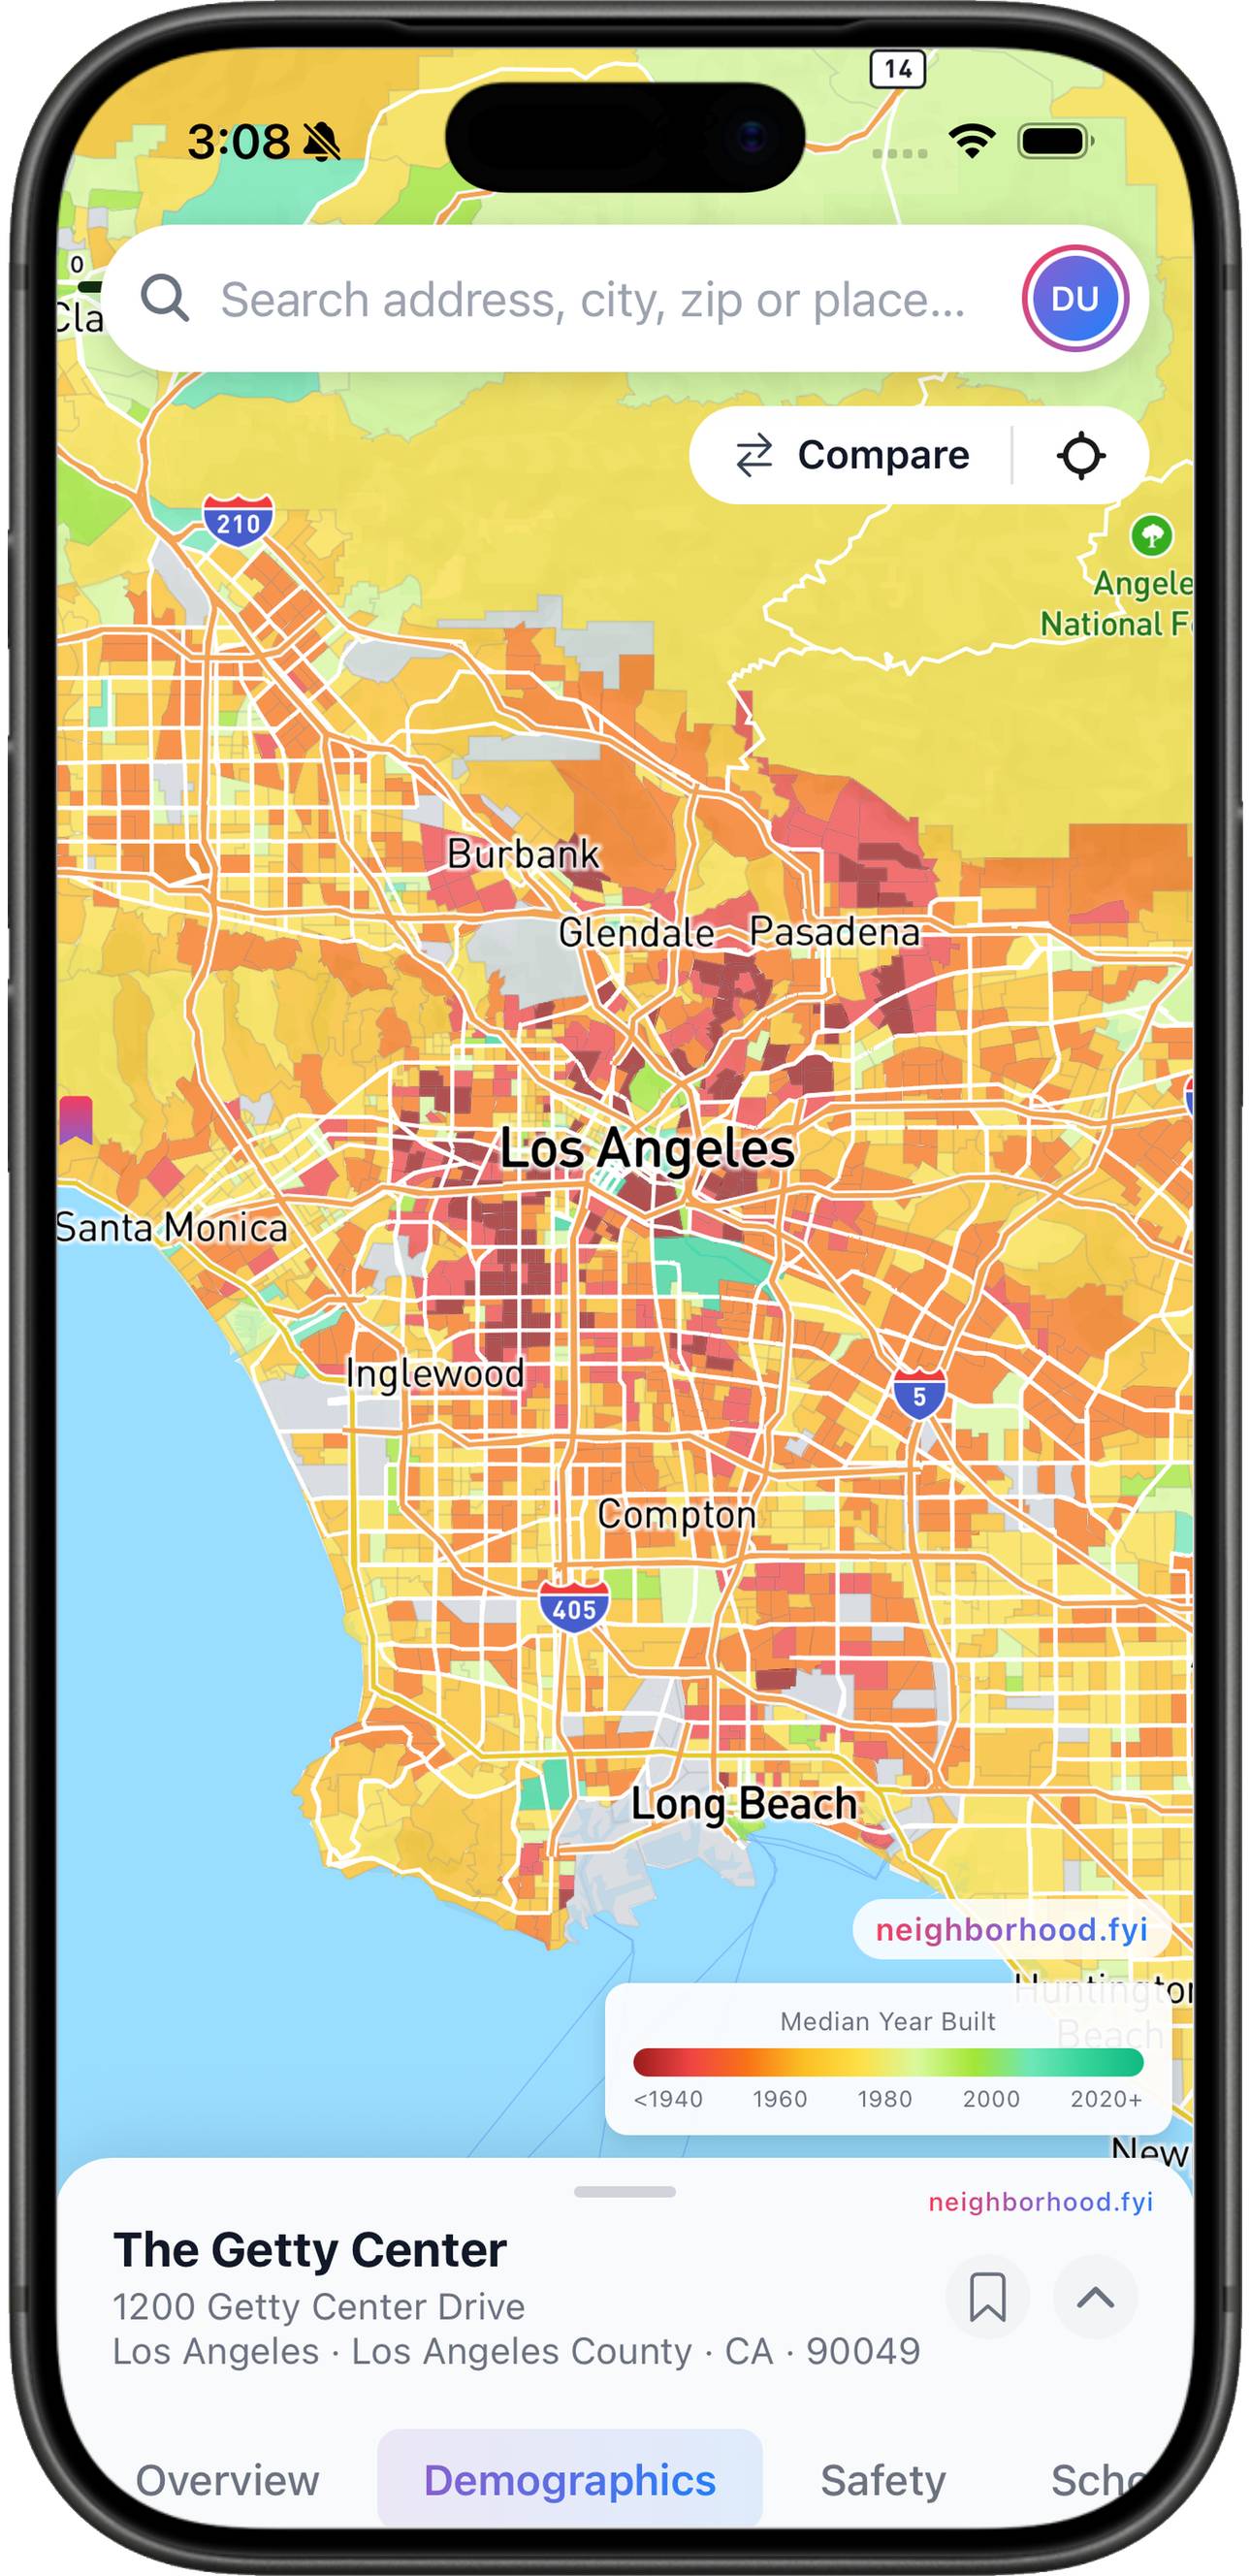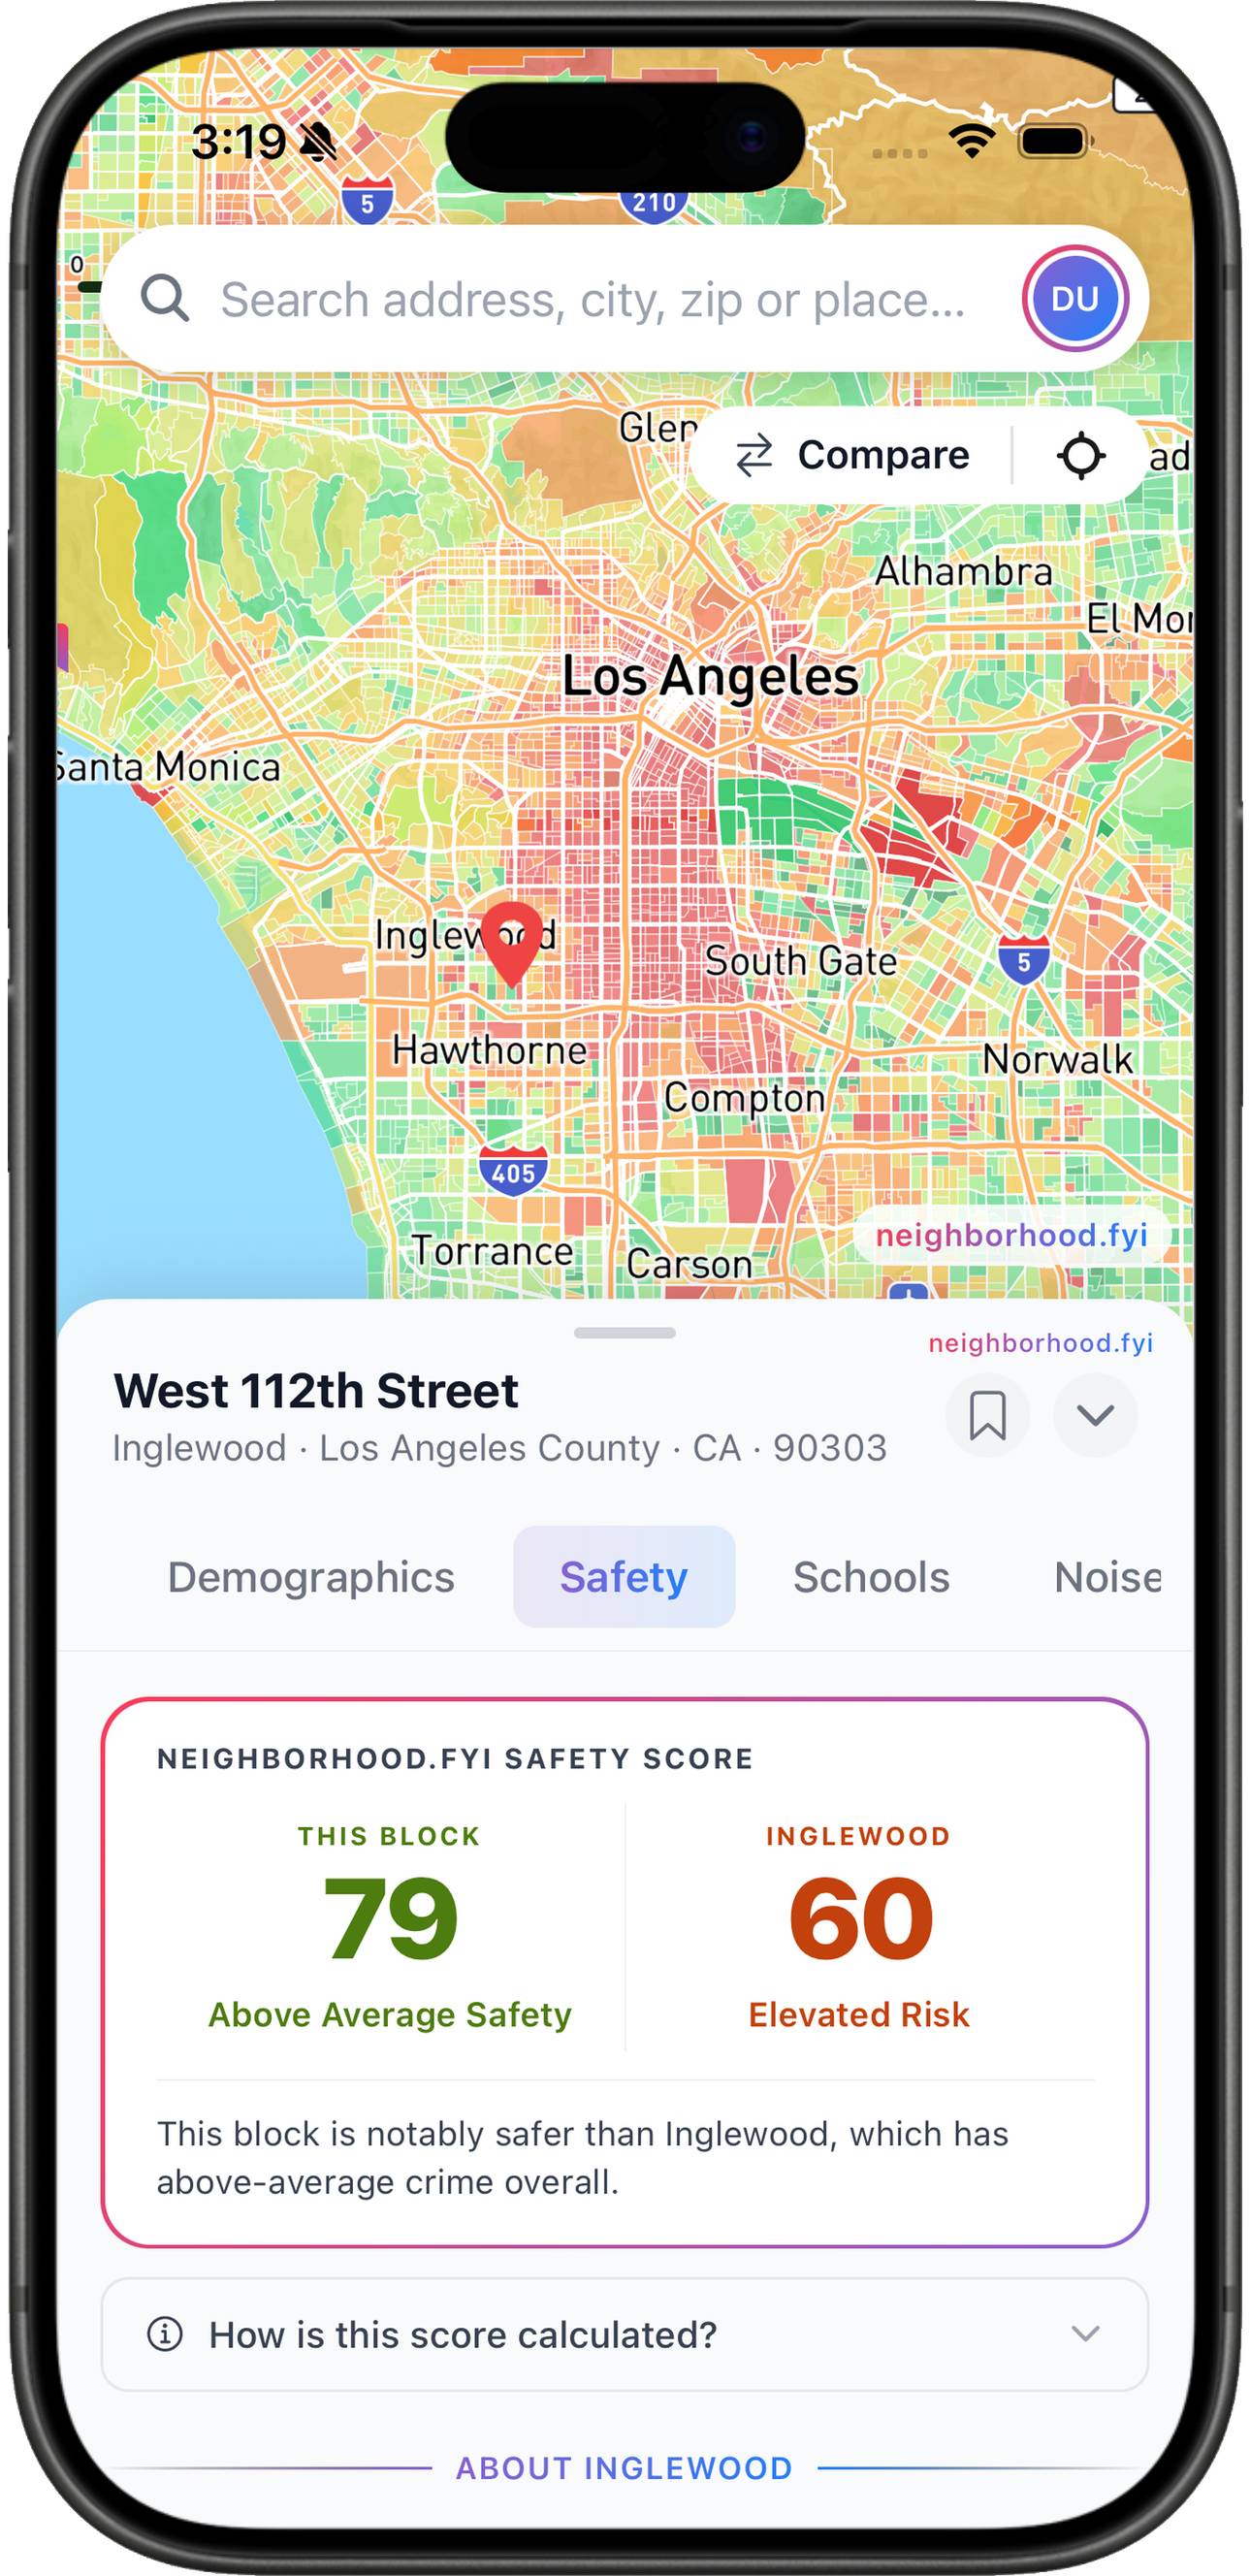
Safety Score
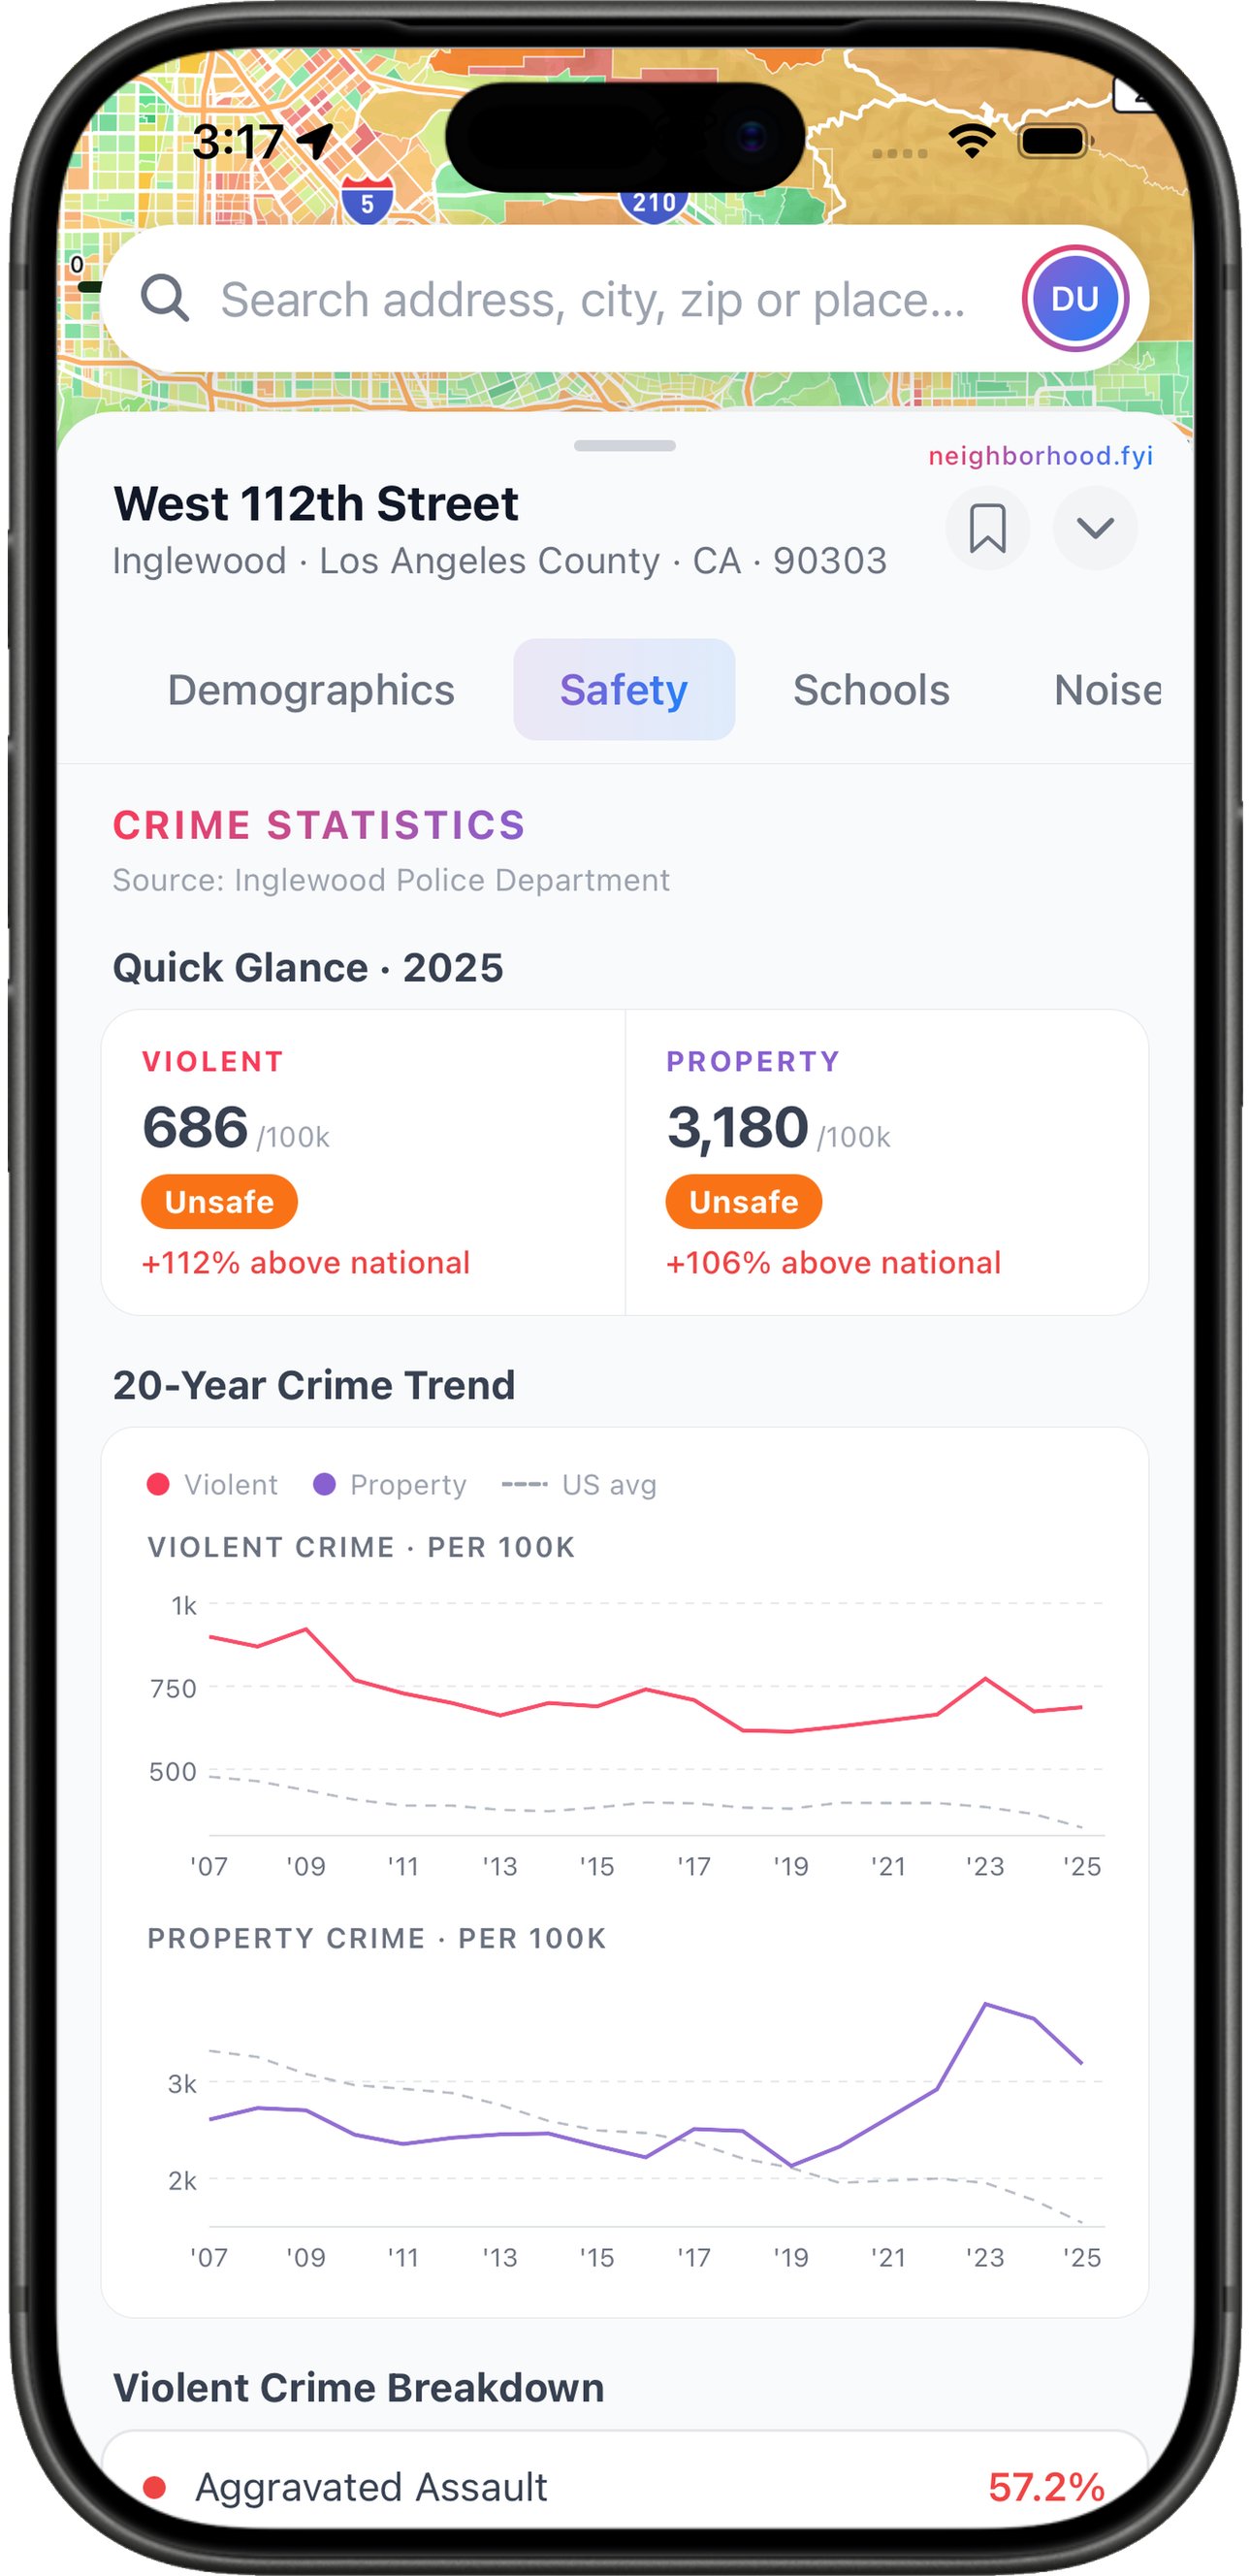
Crime Stats
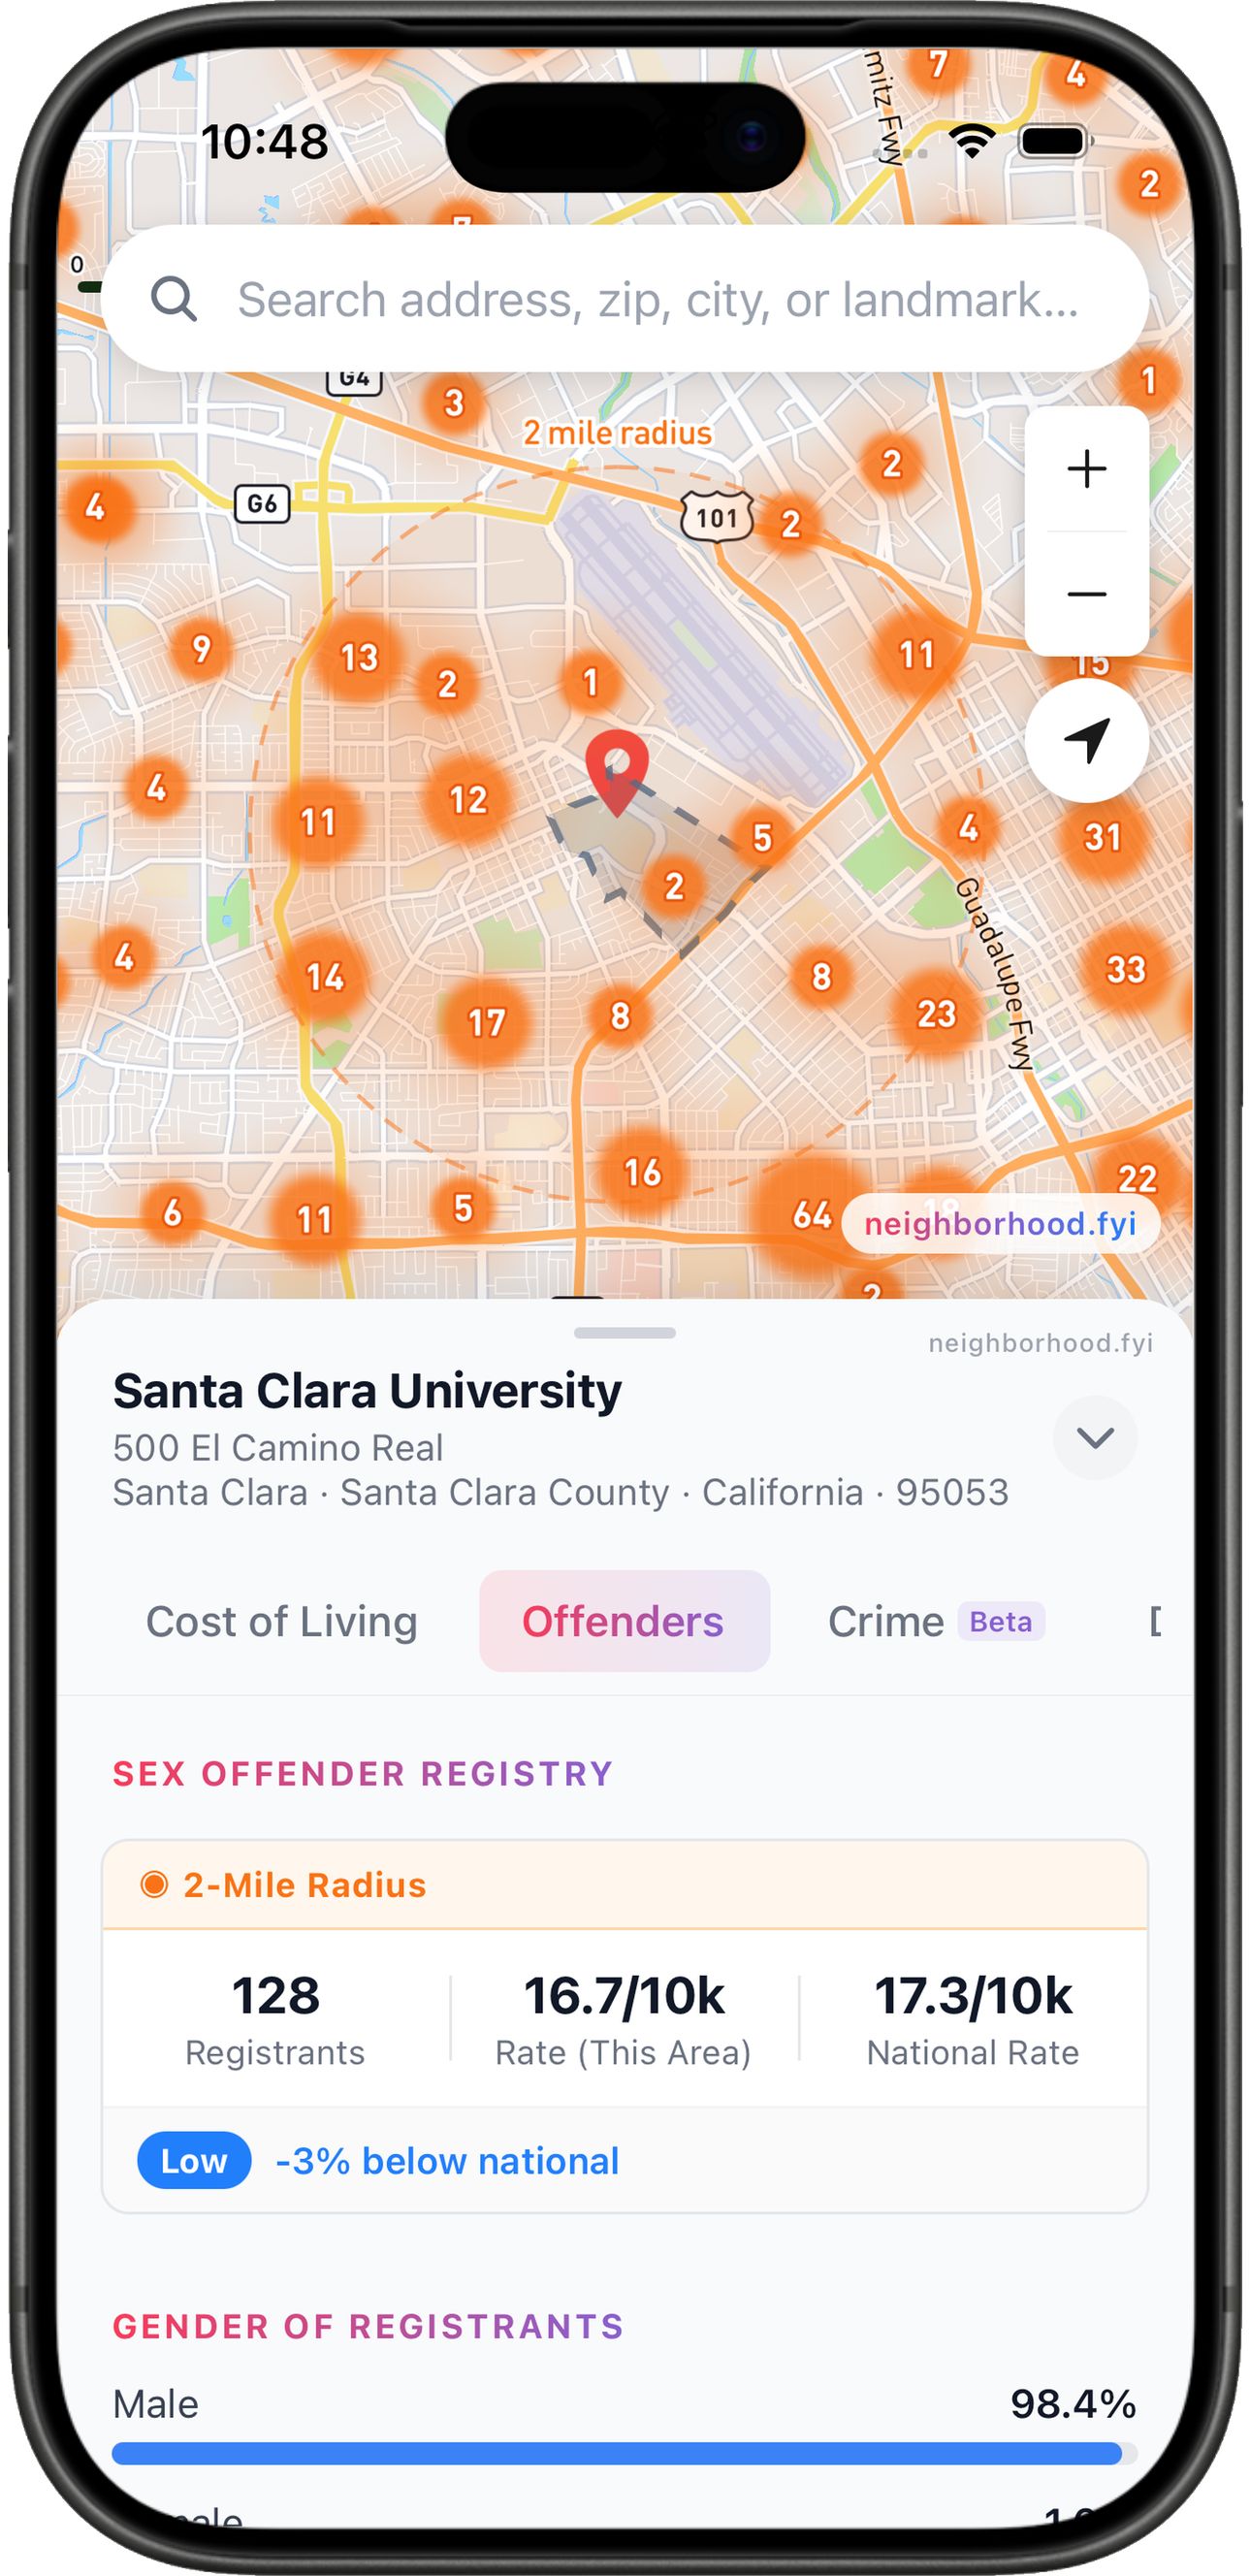
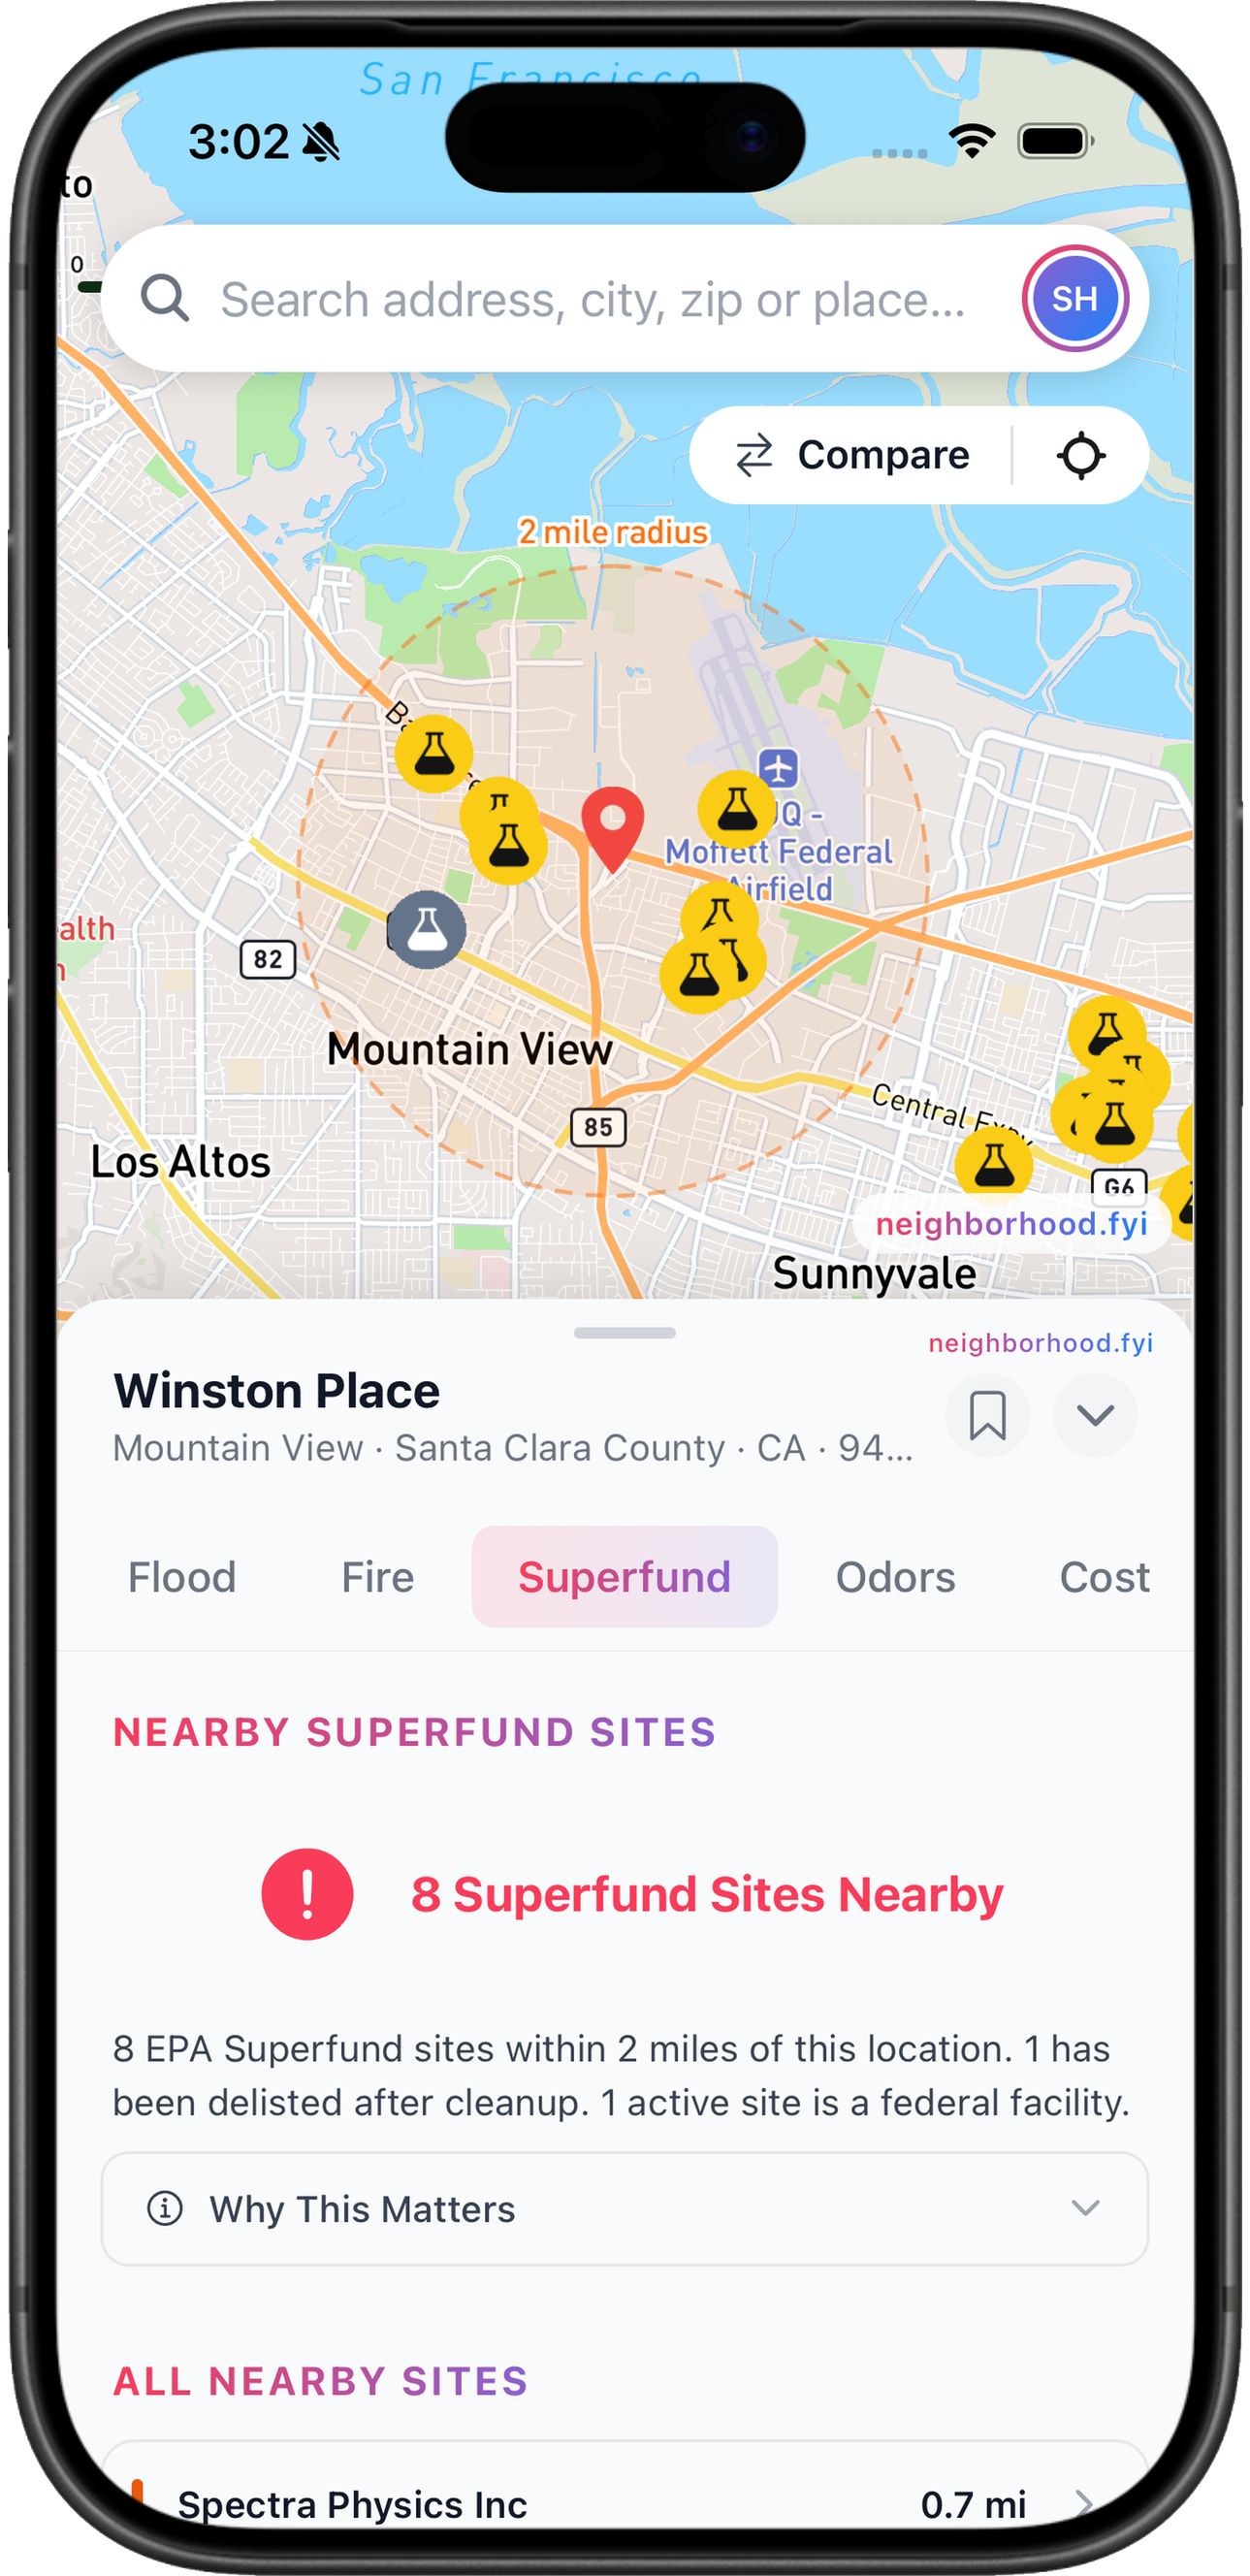
Offender Map
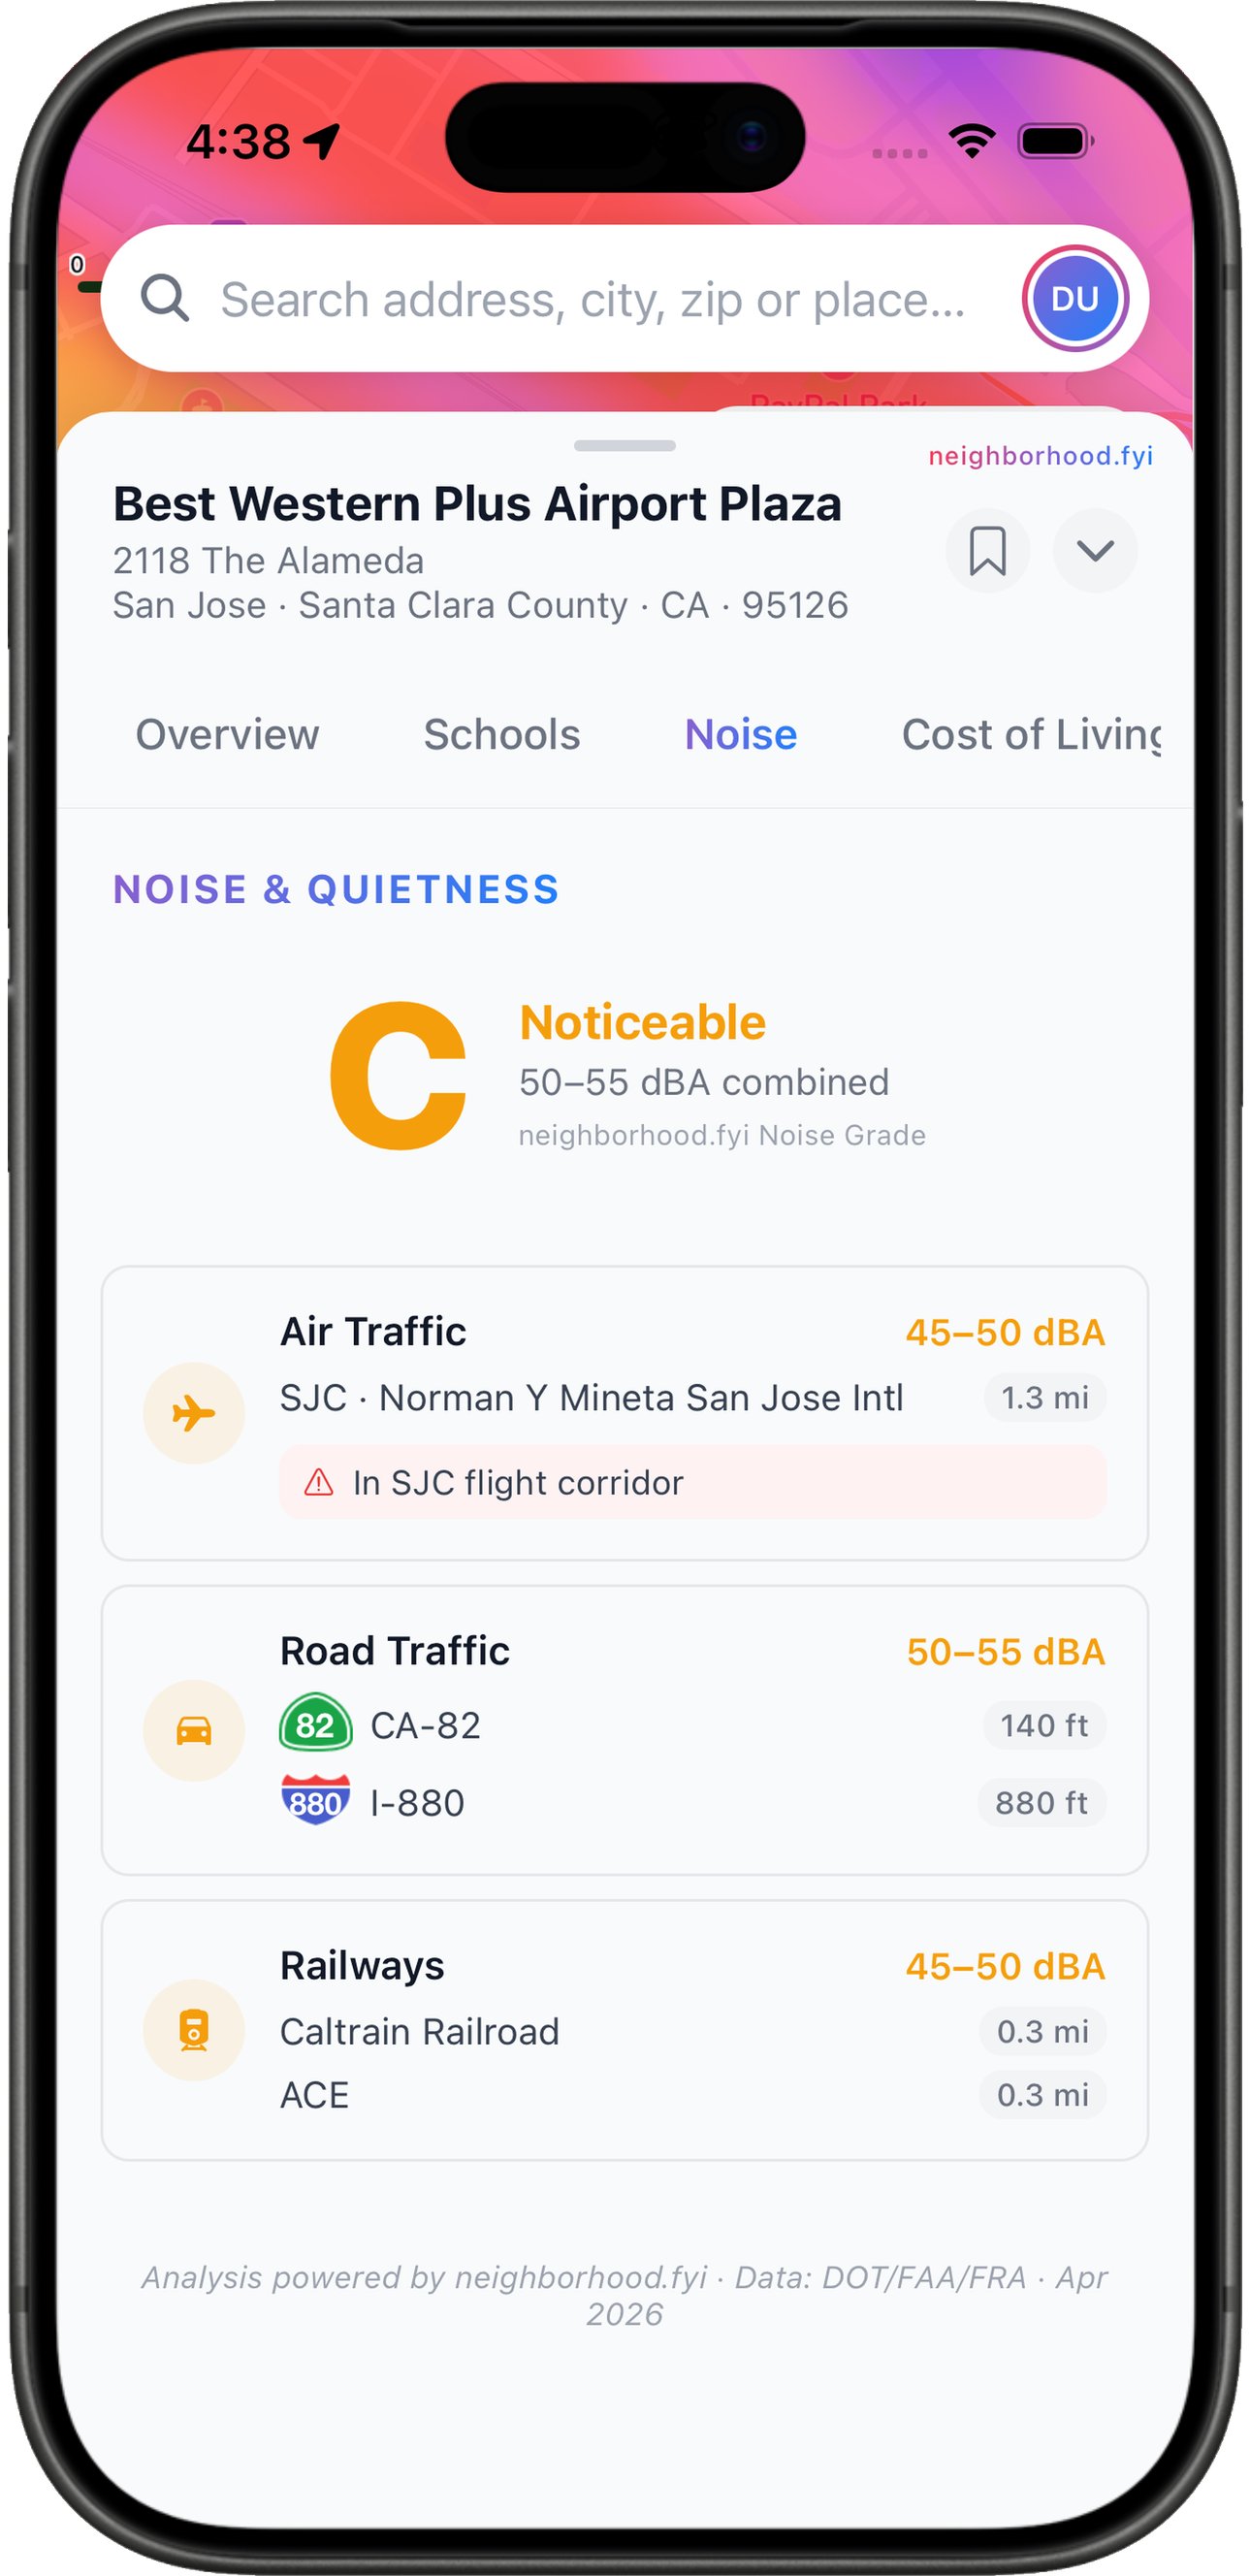
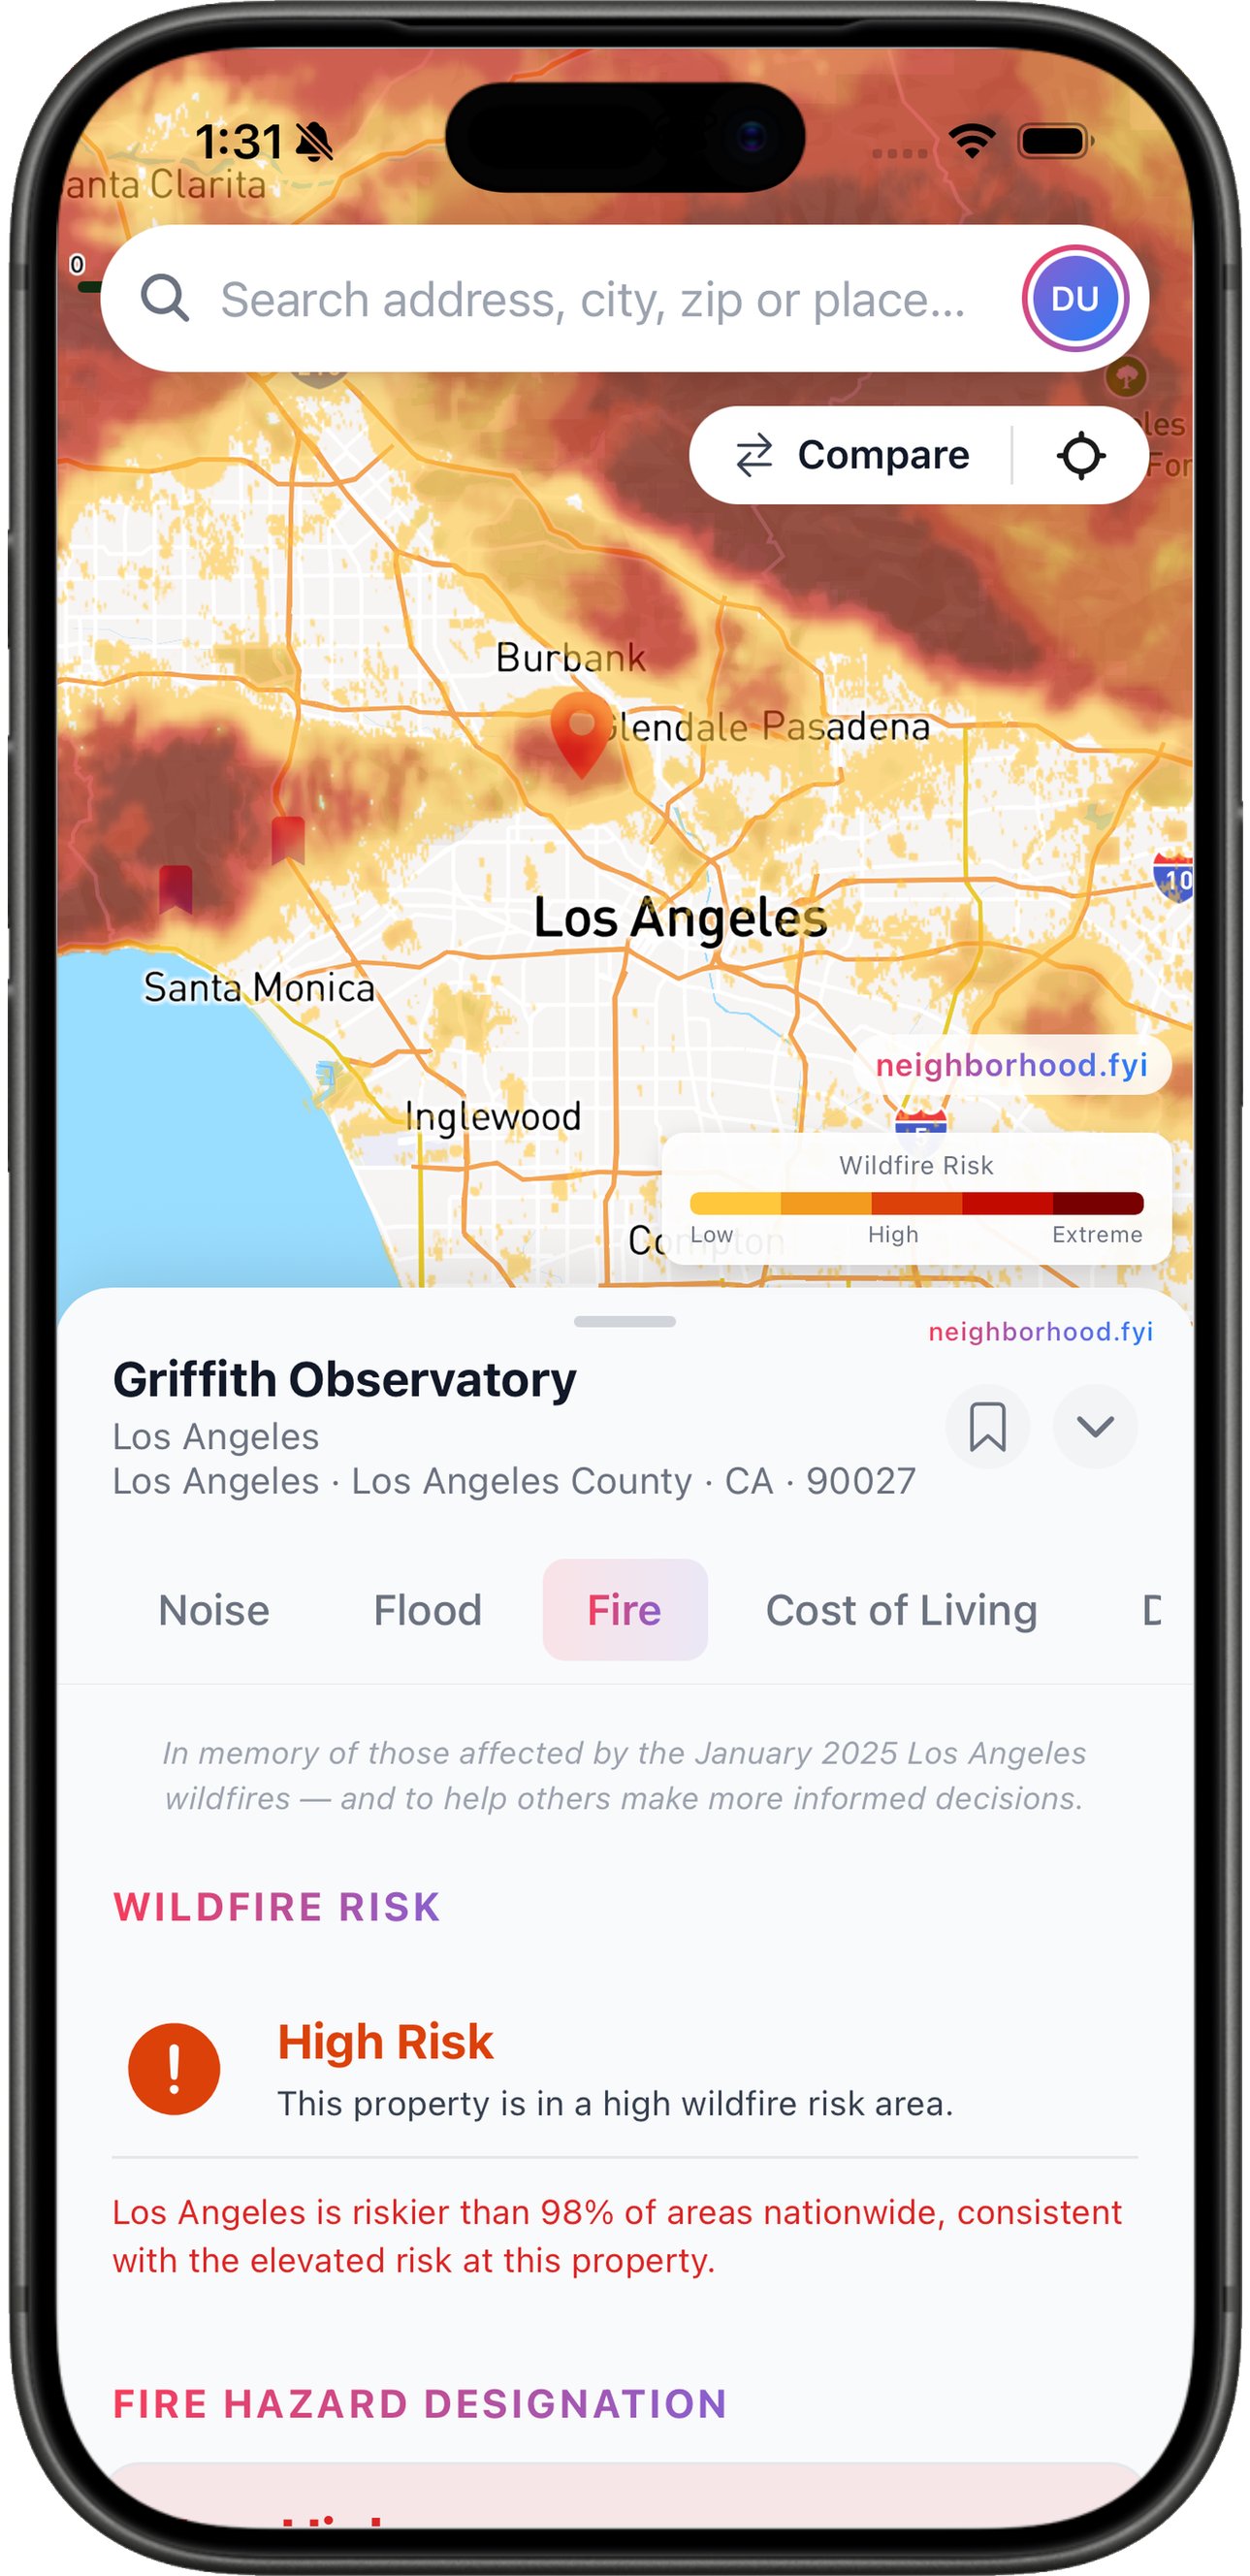
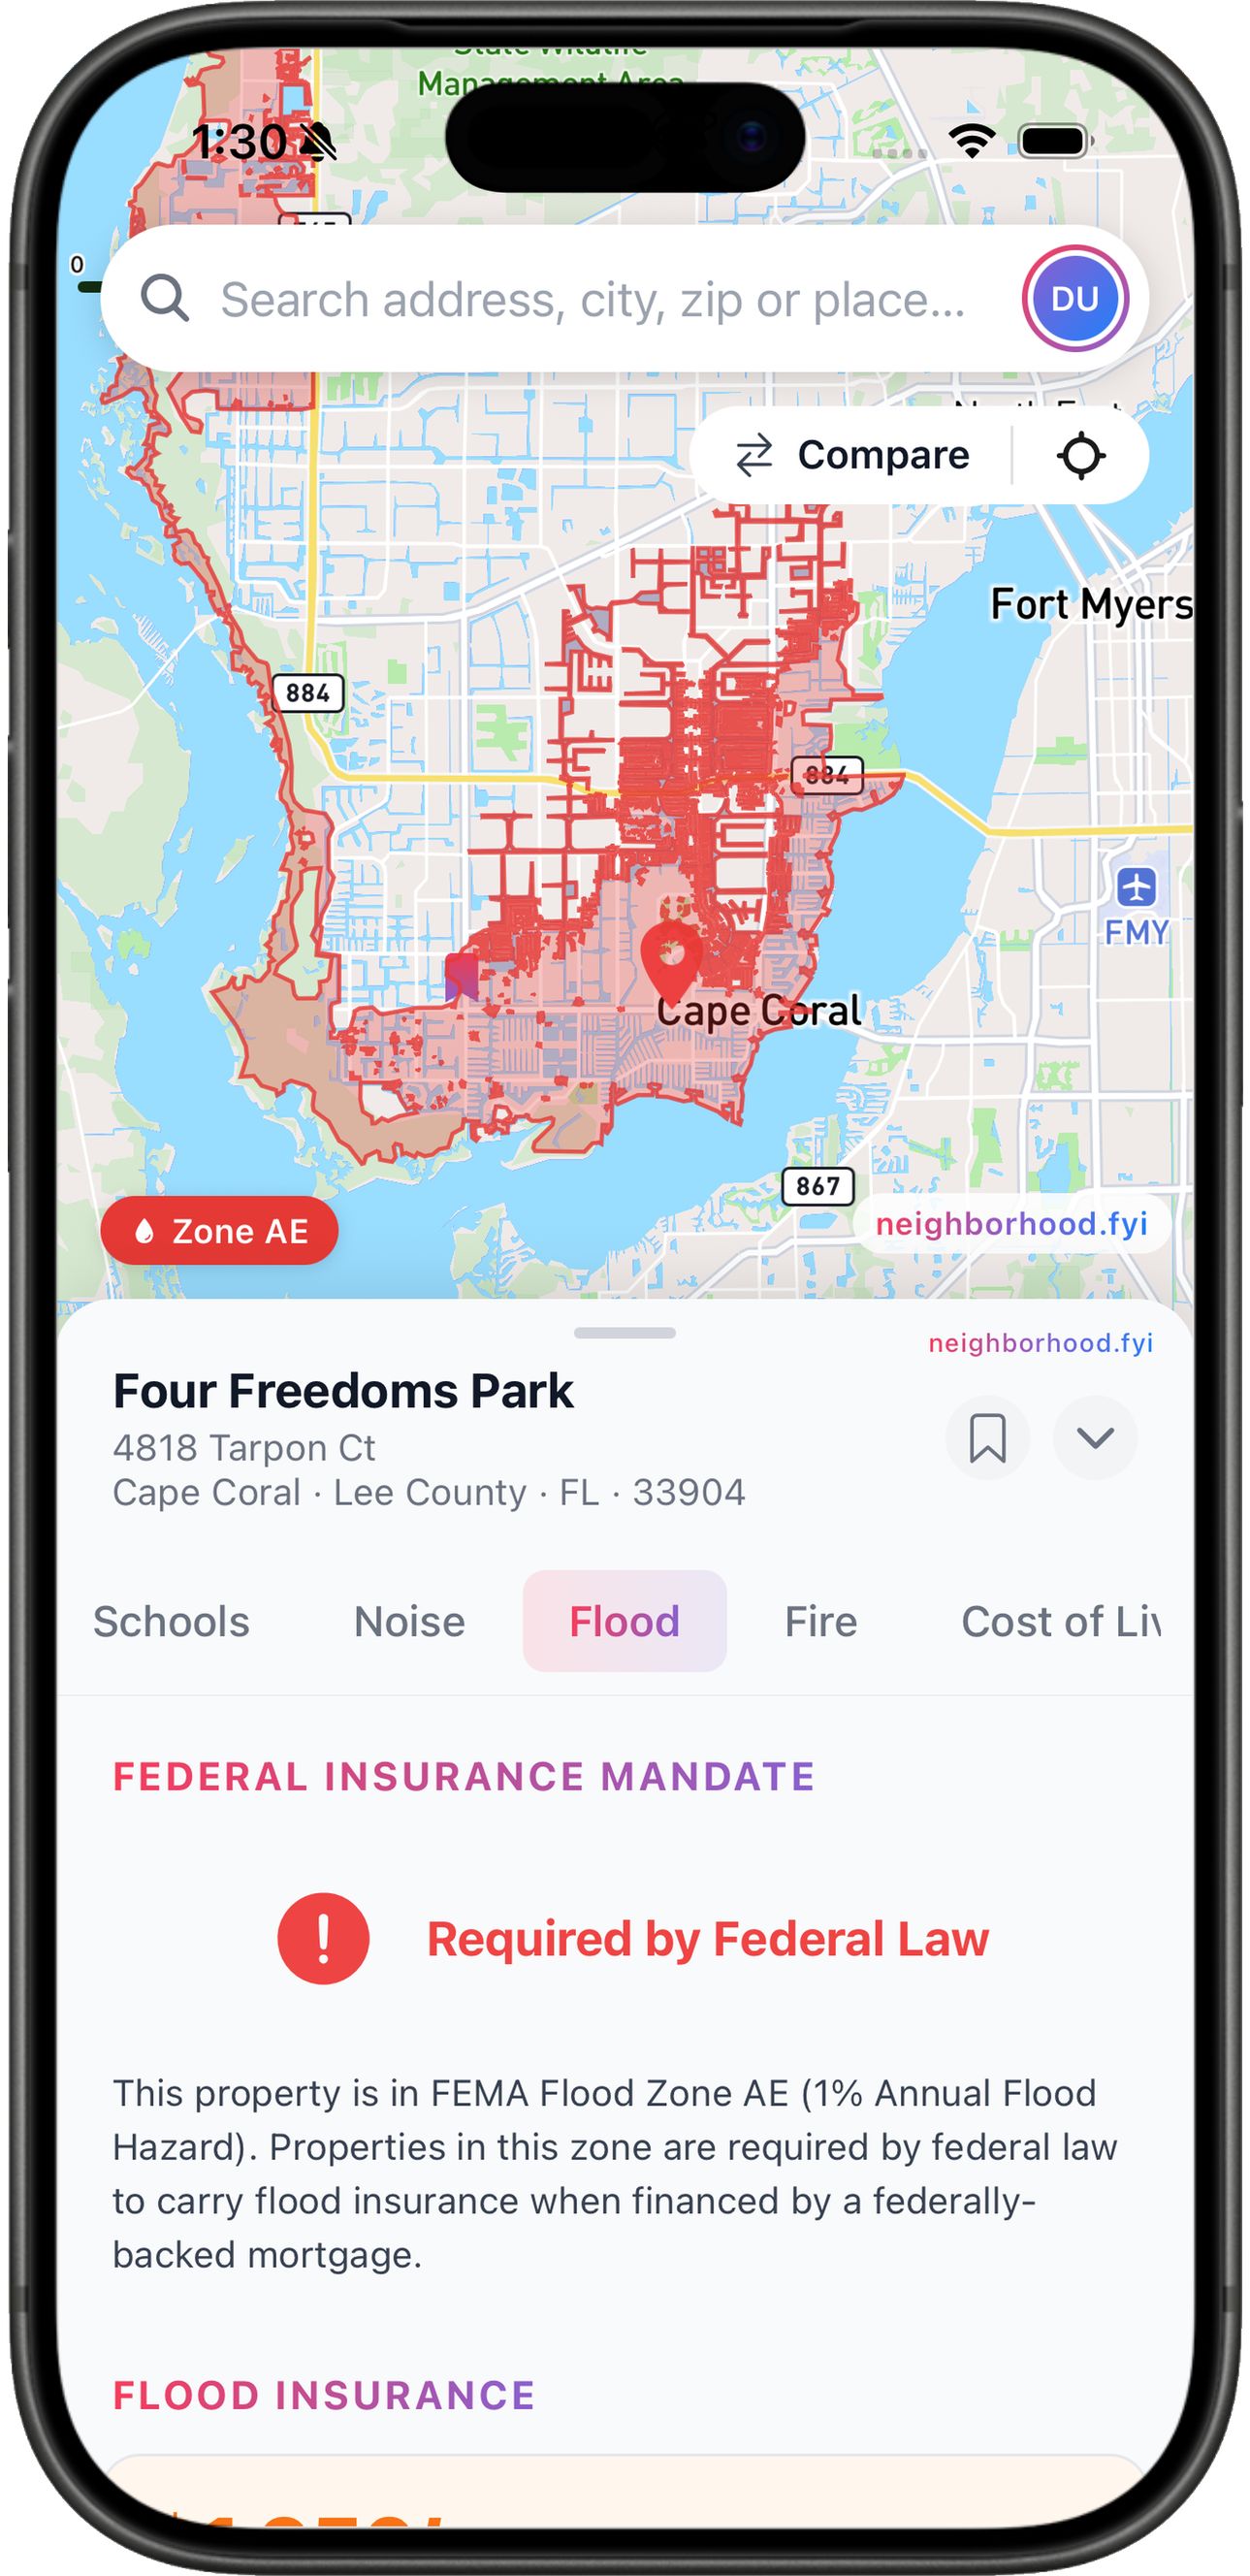
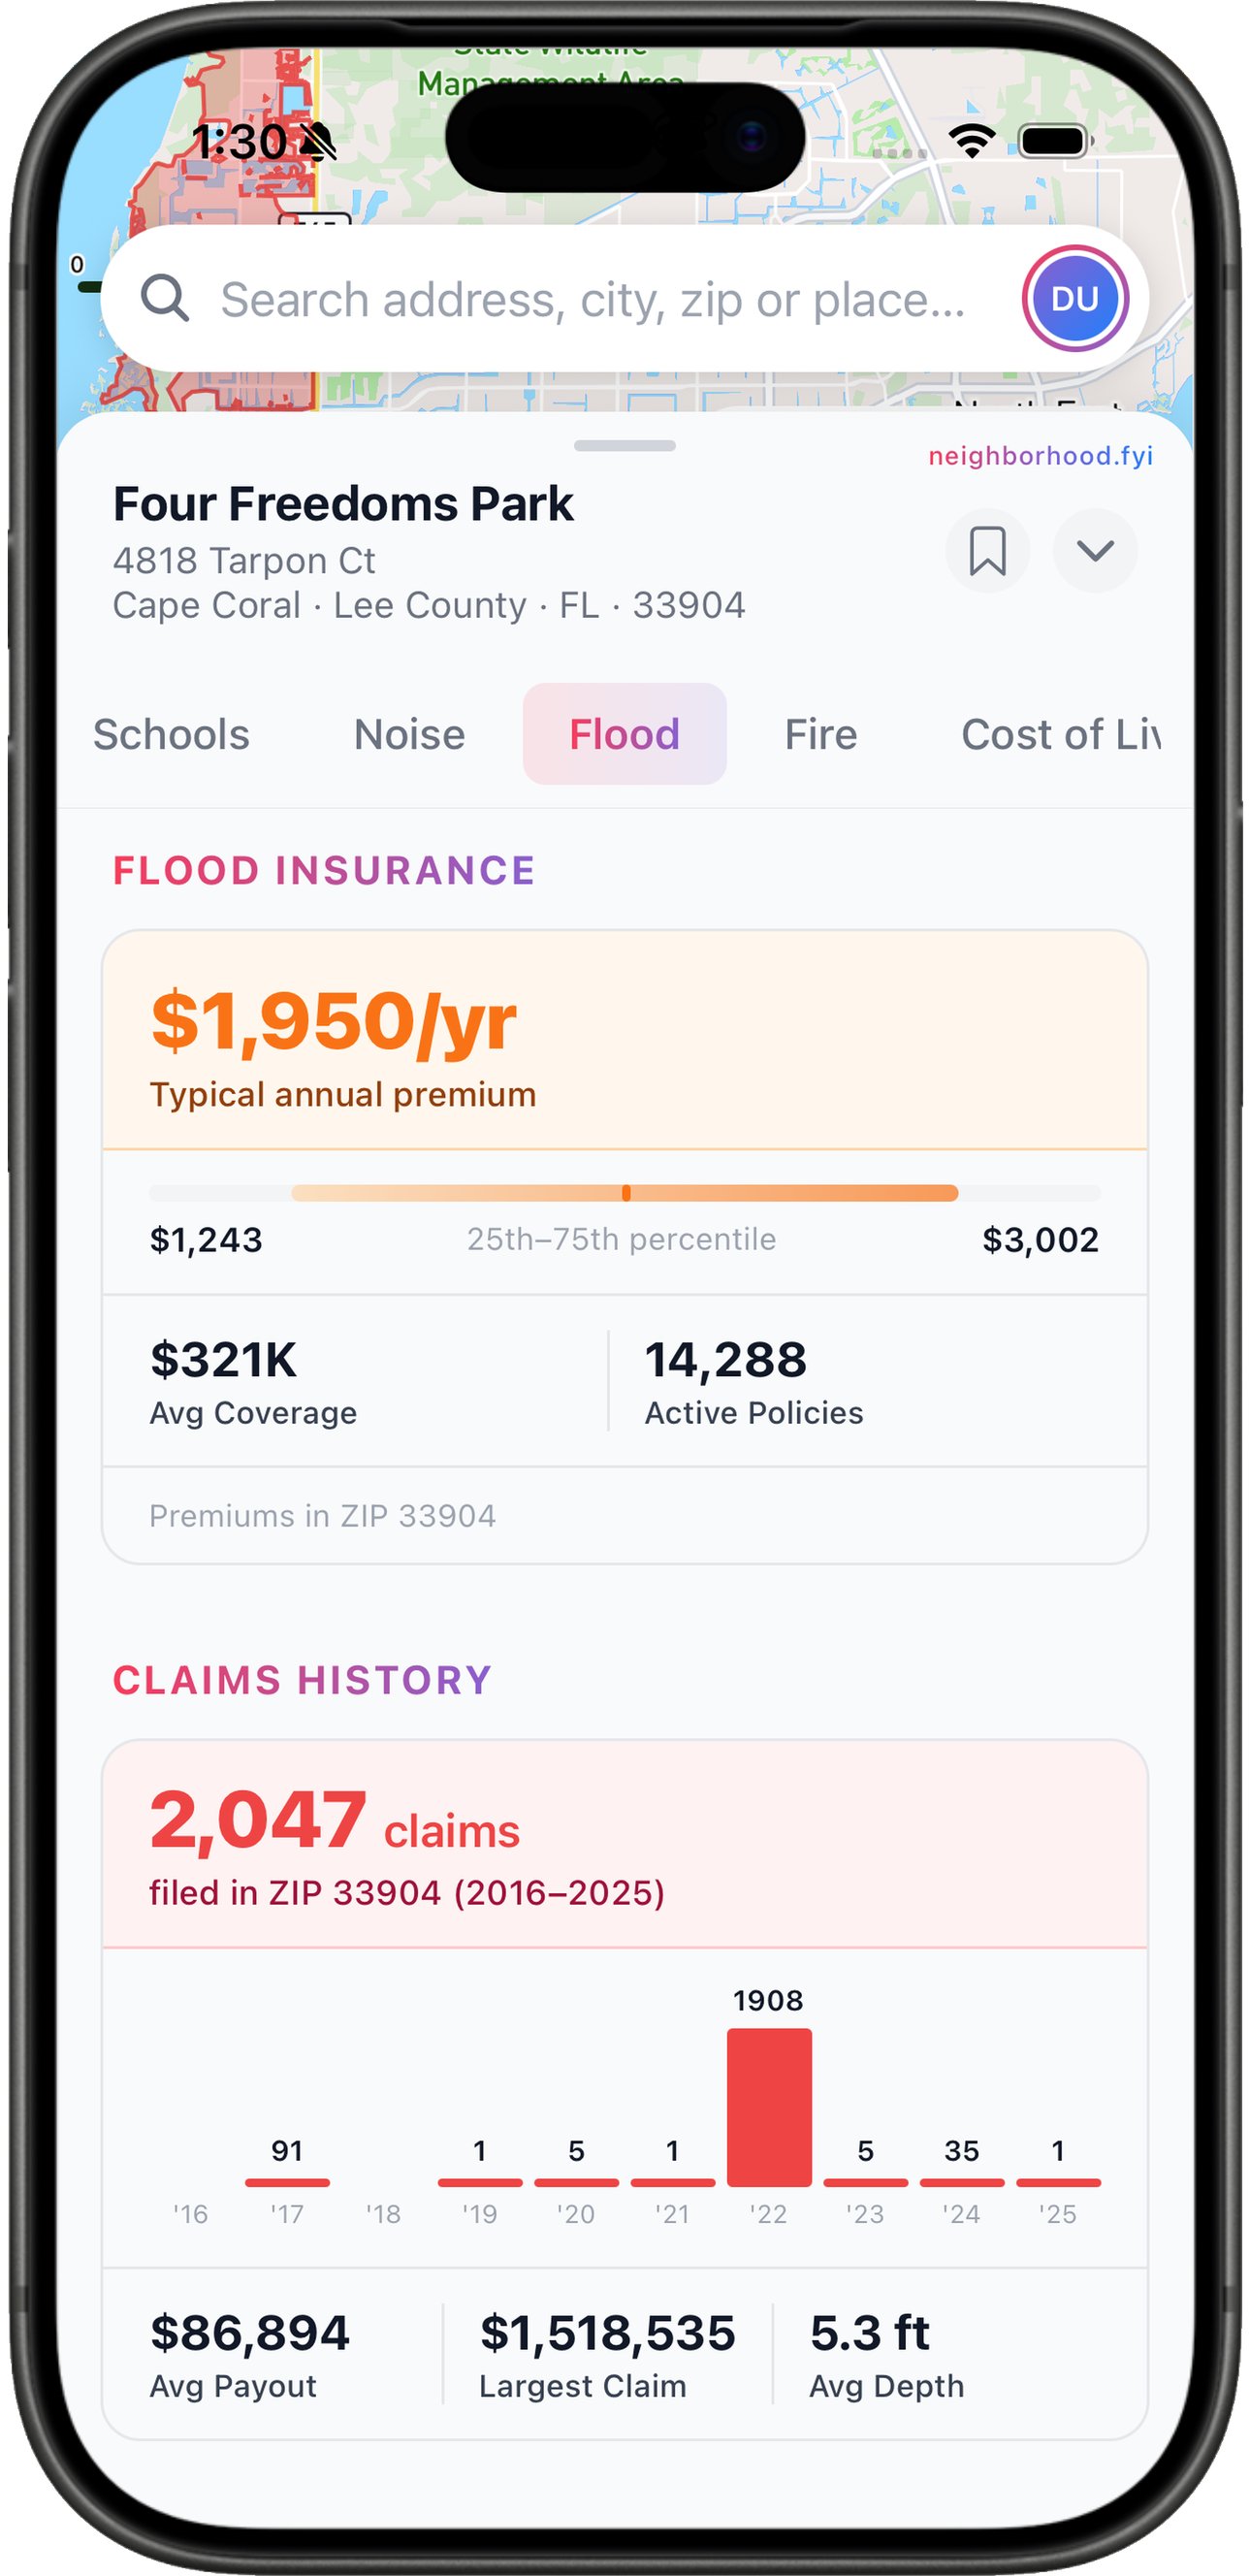
Safety
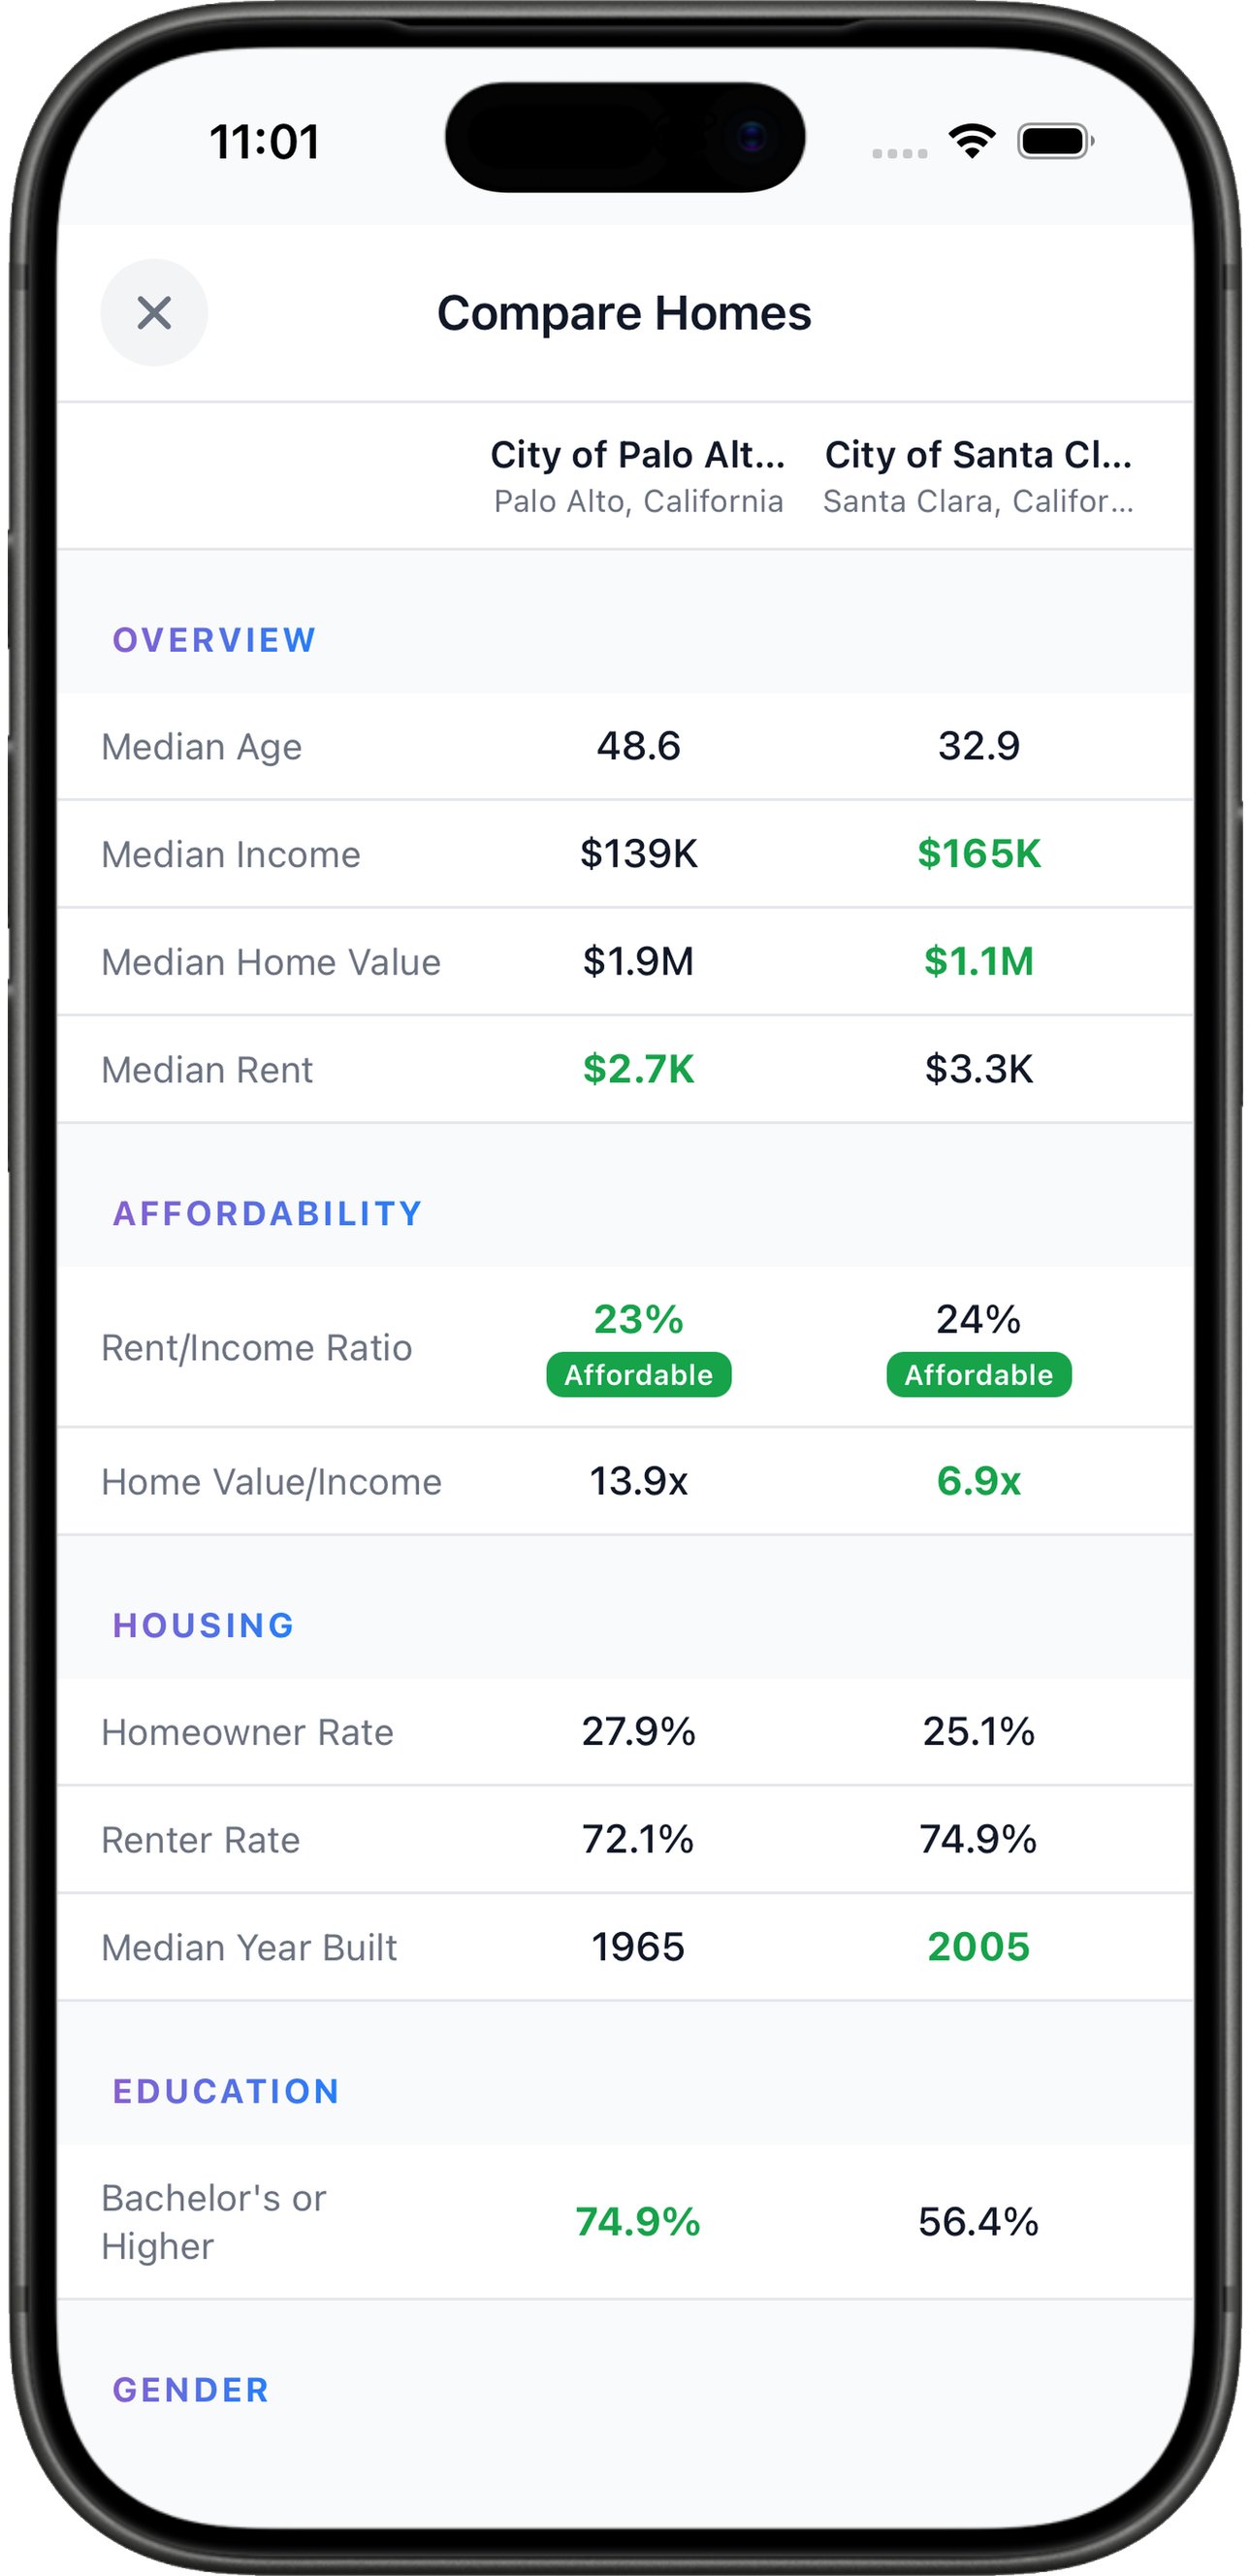
Know the risks before you move.
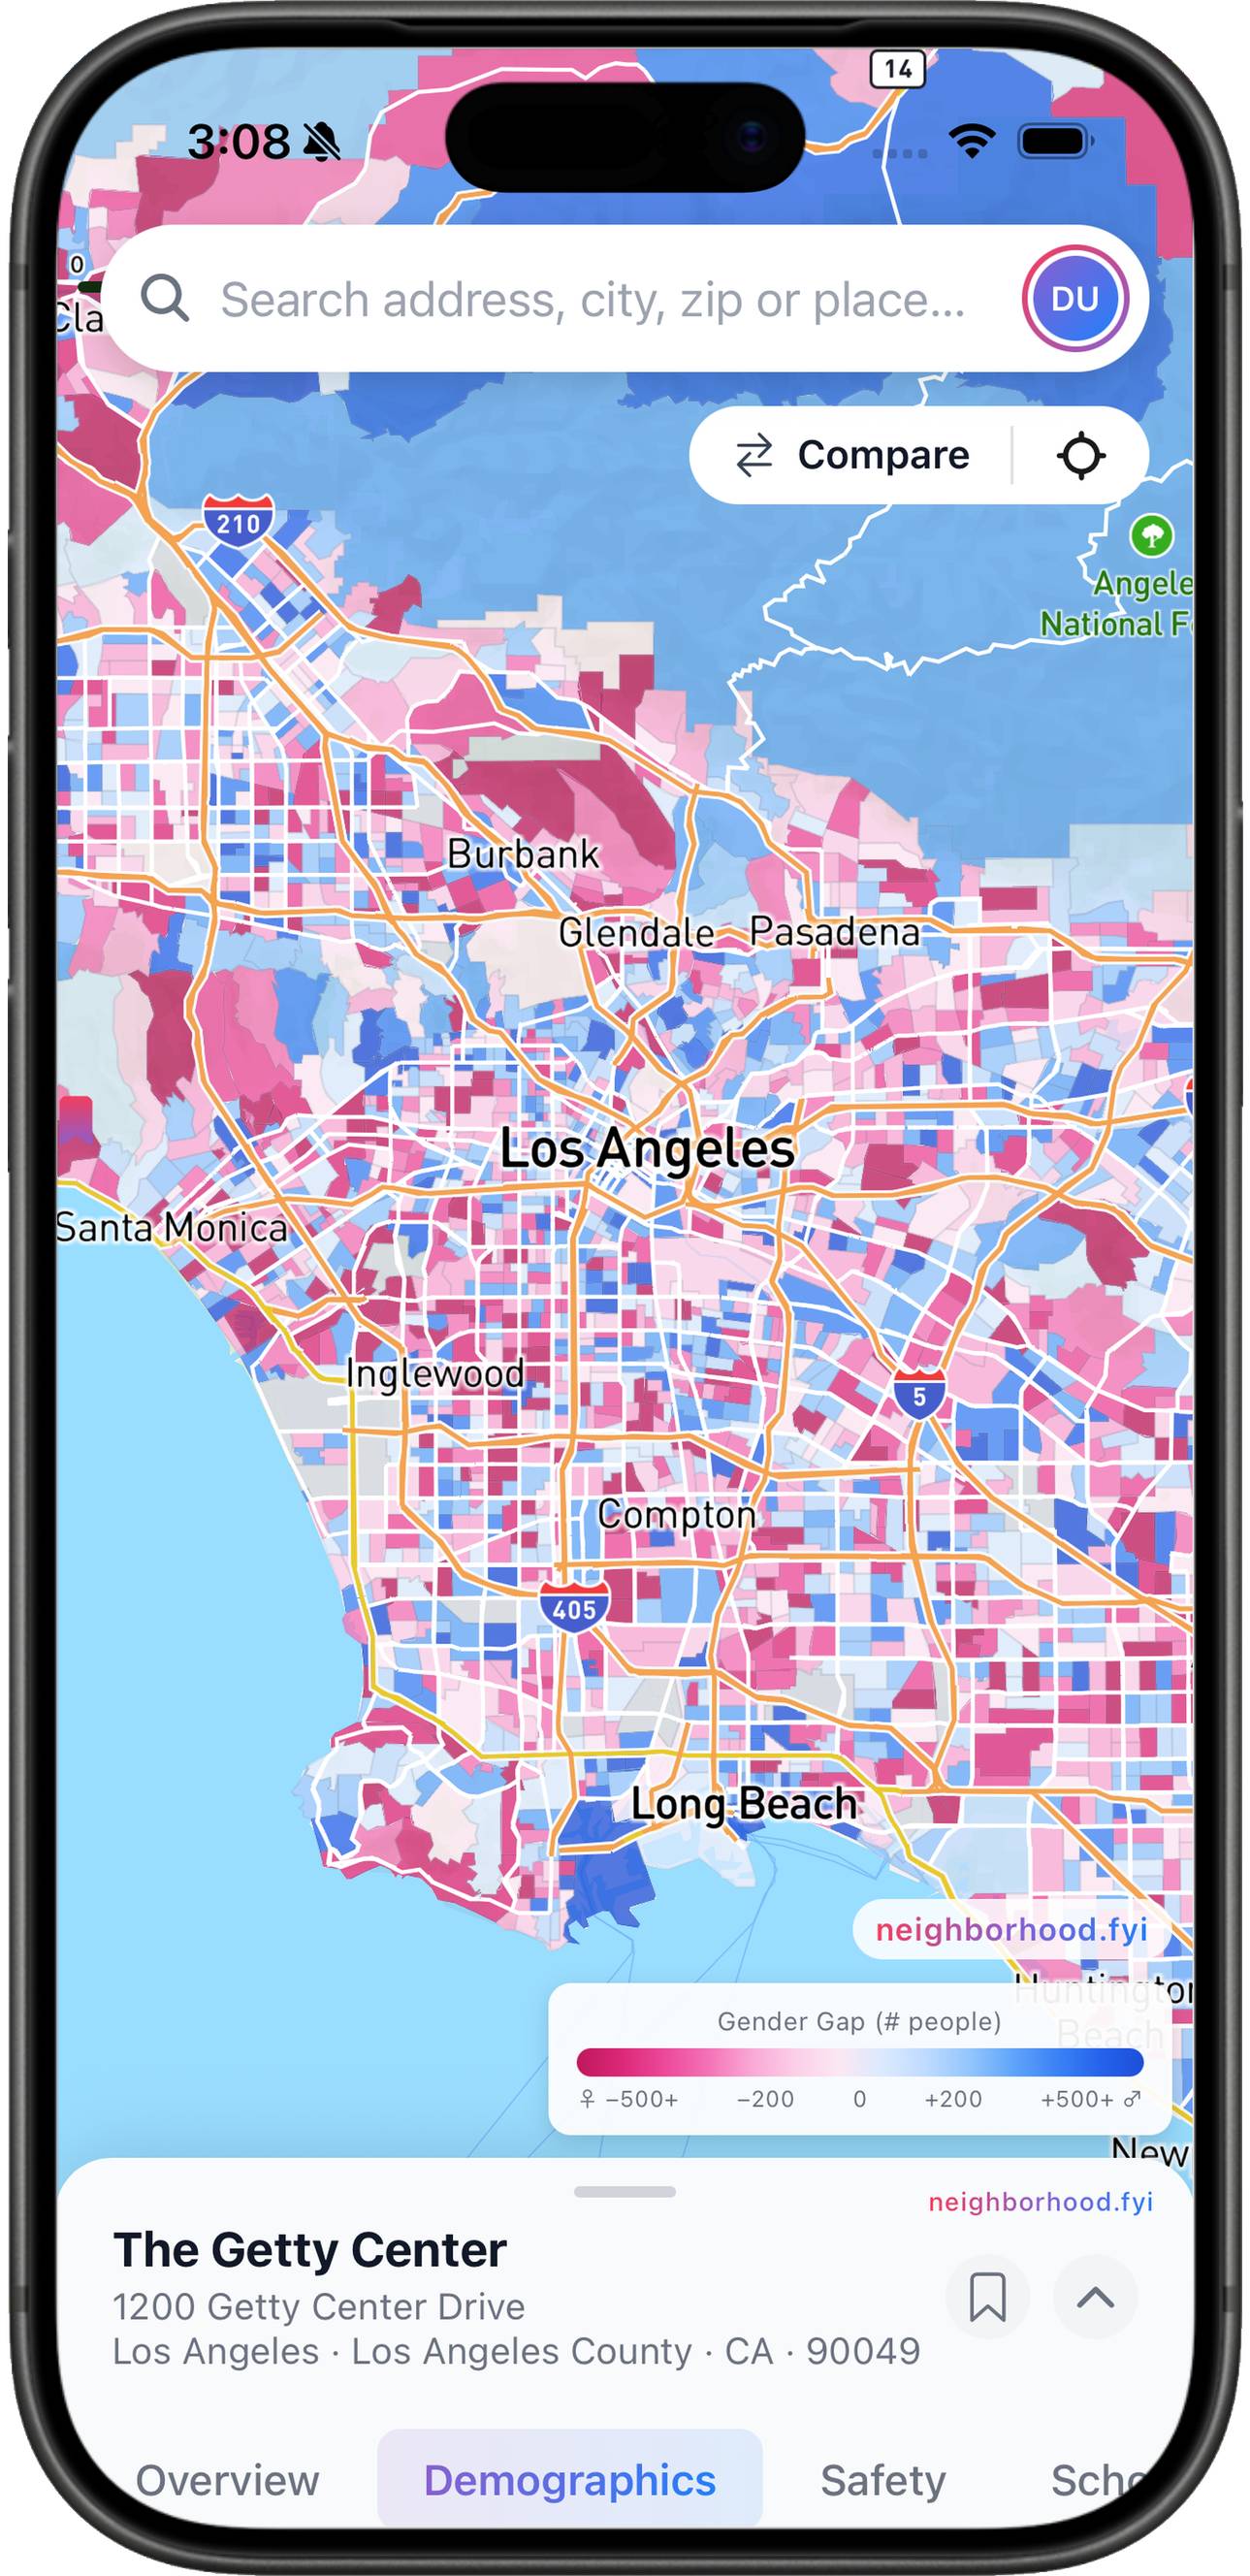
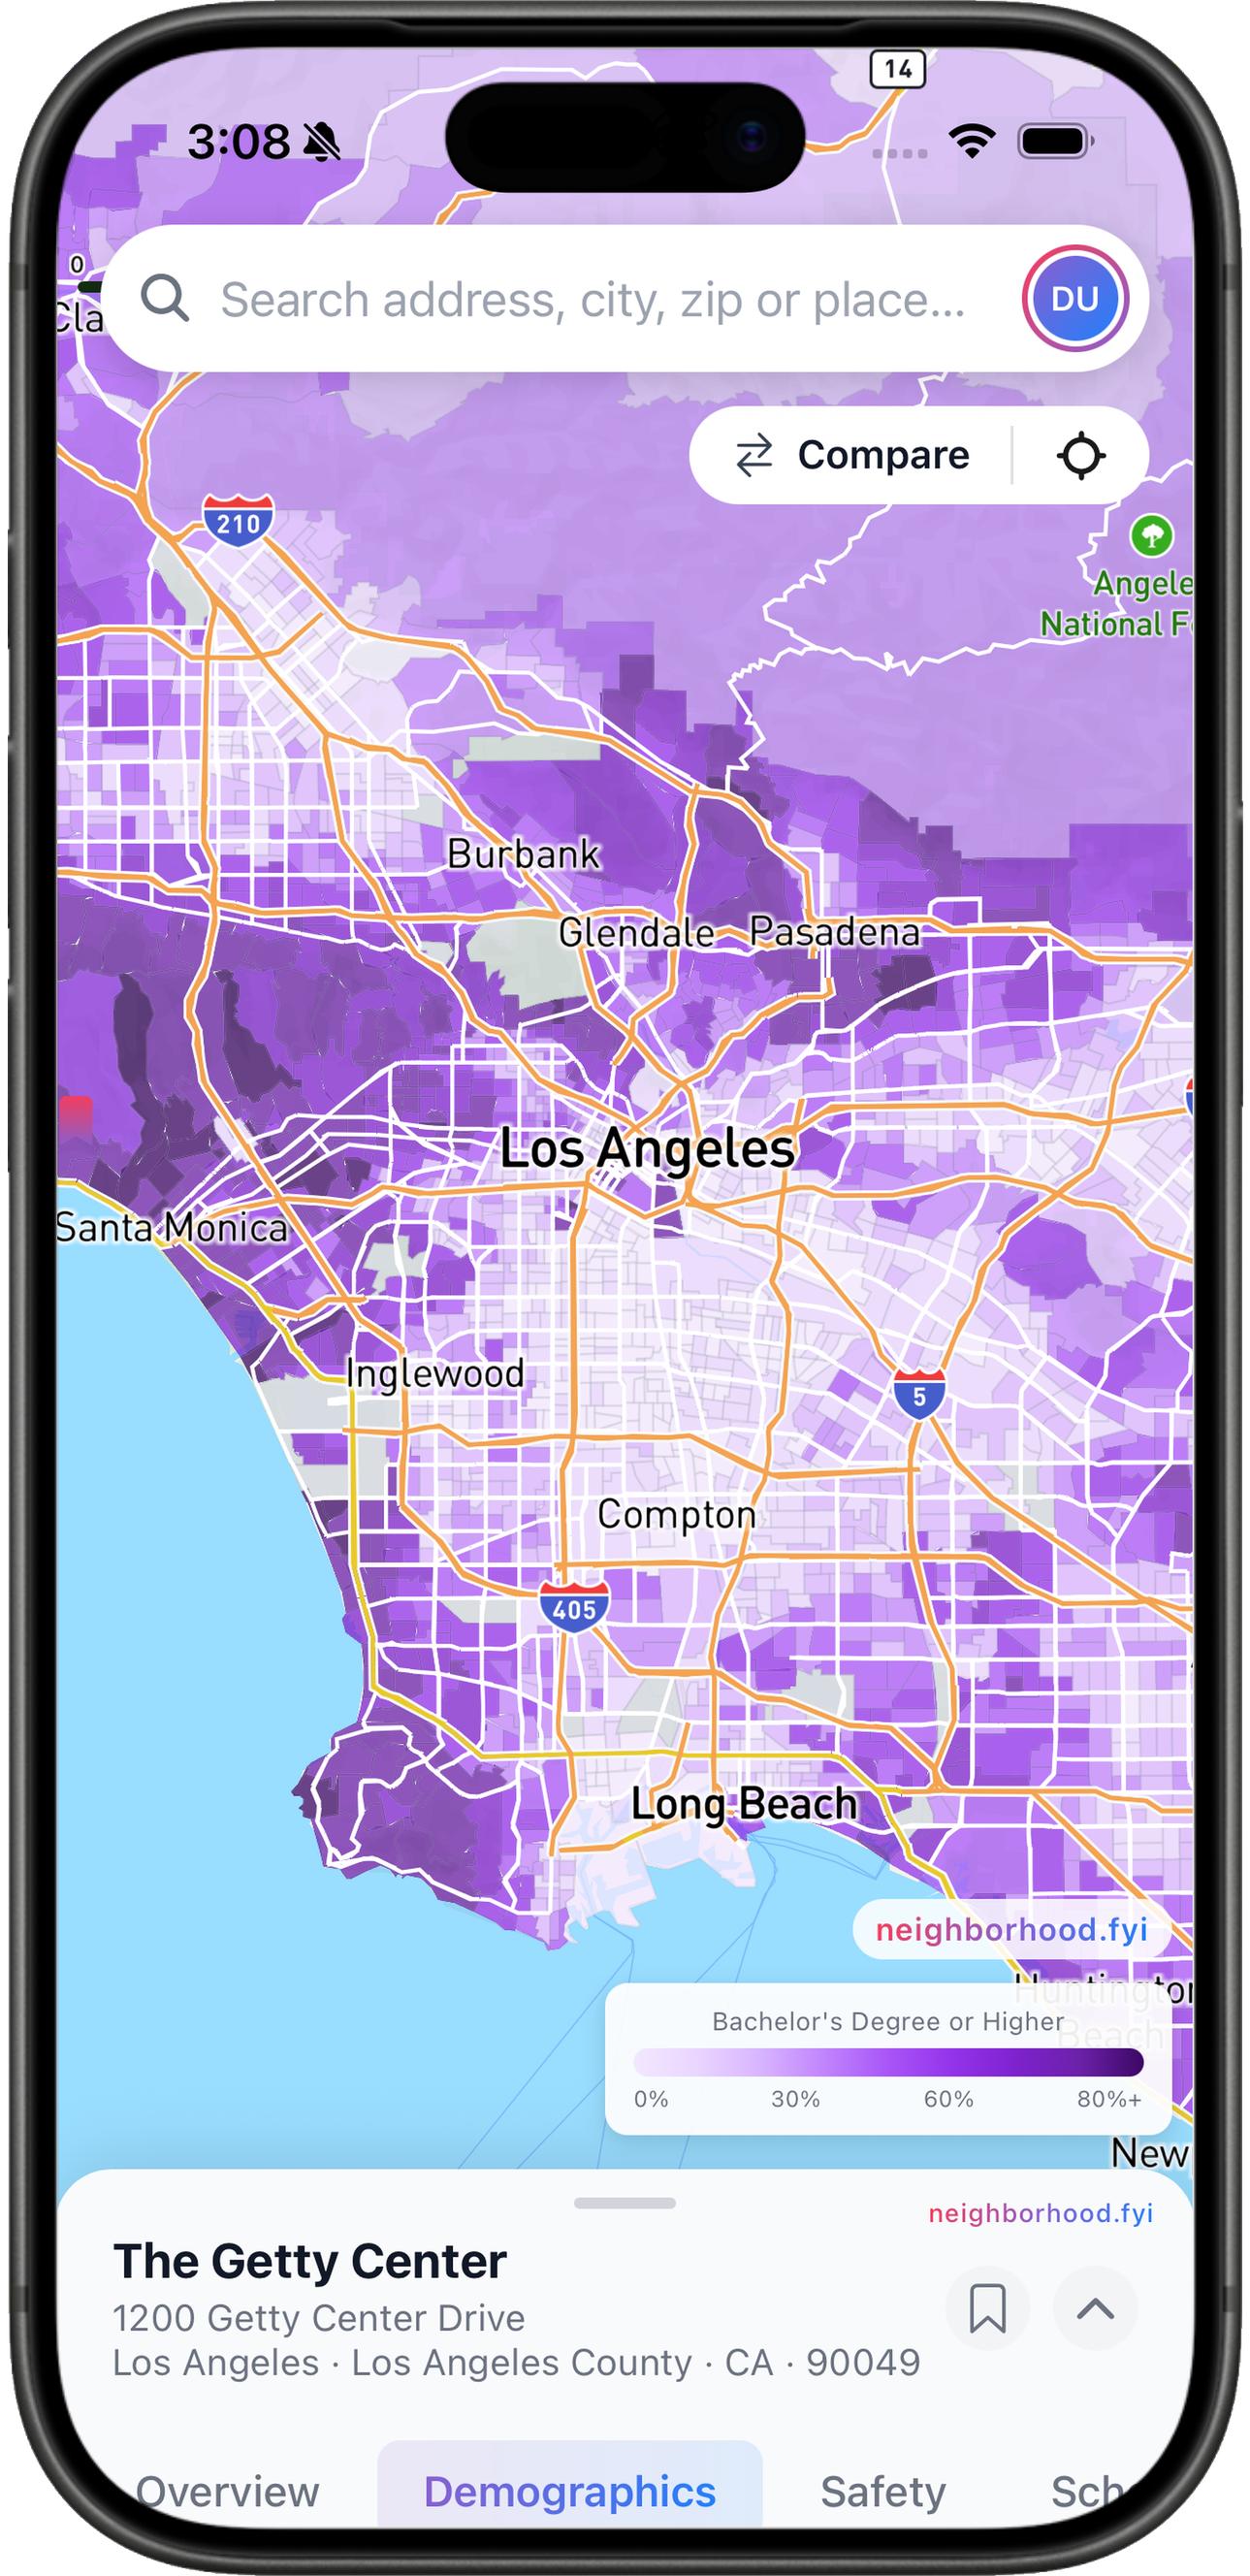
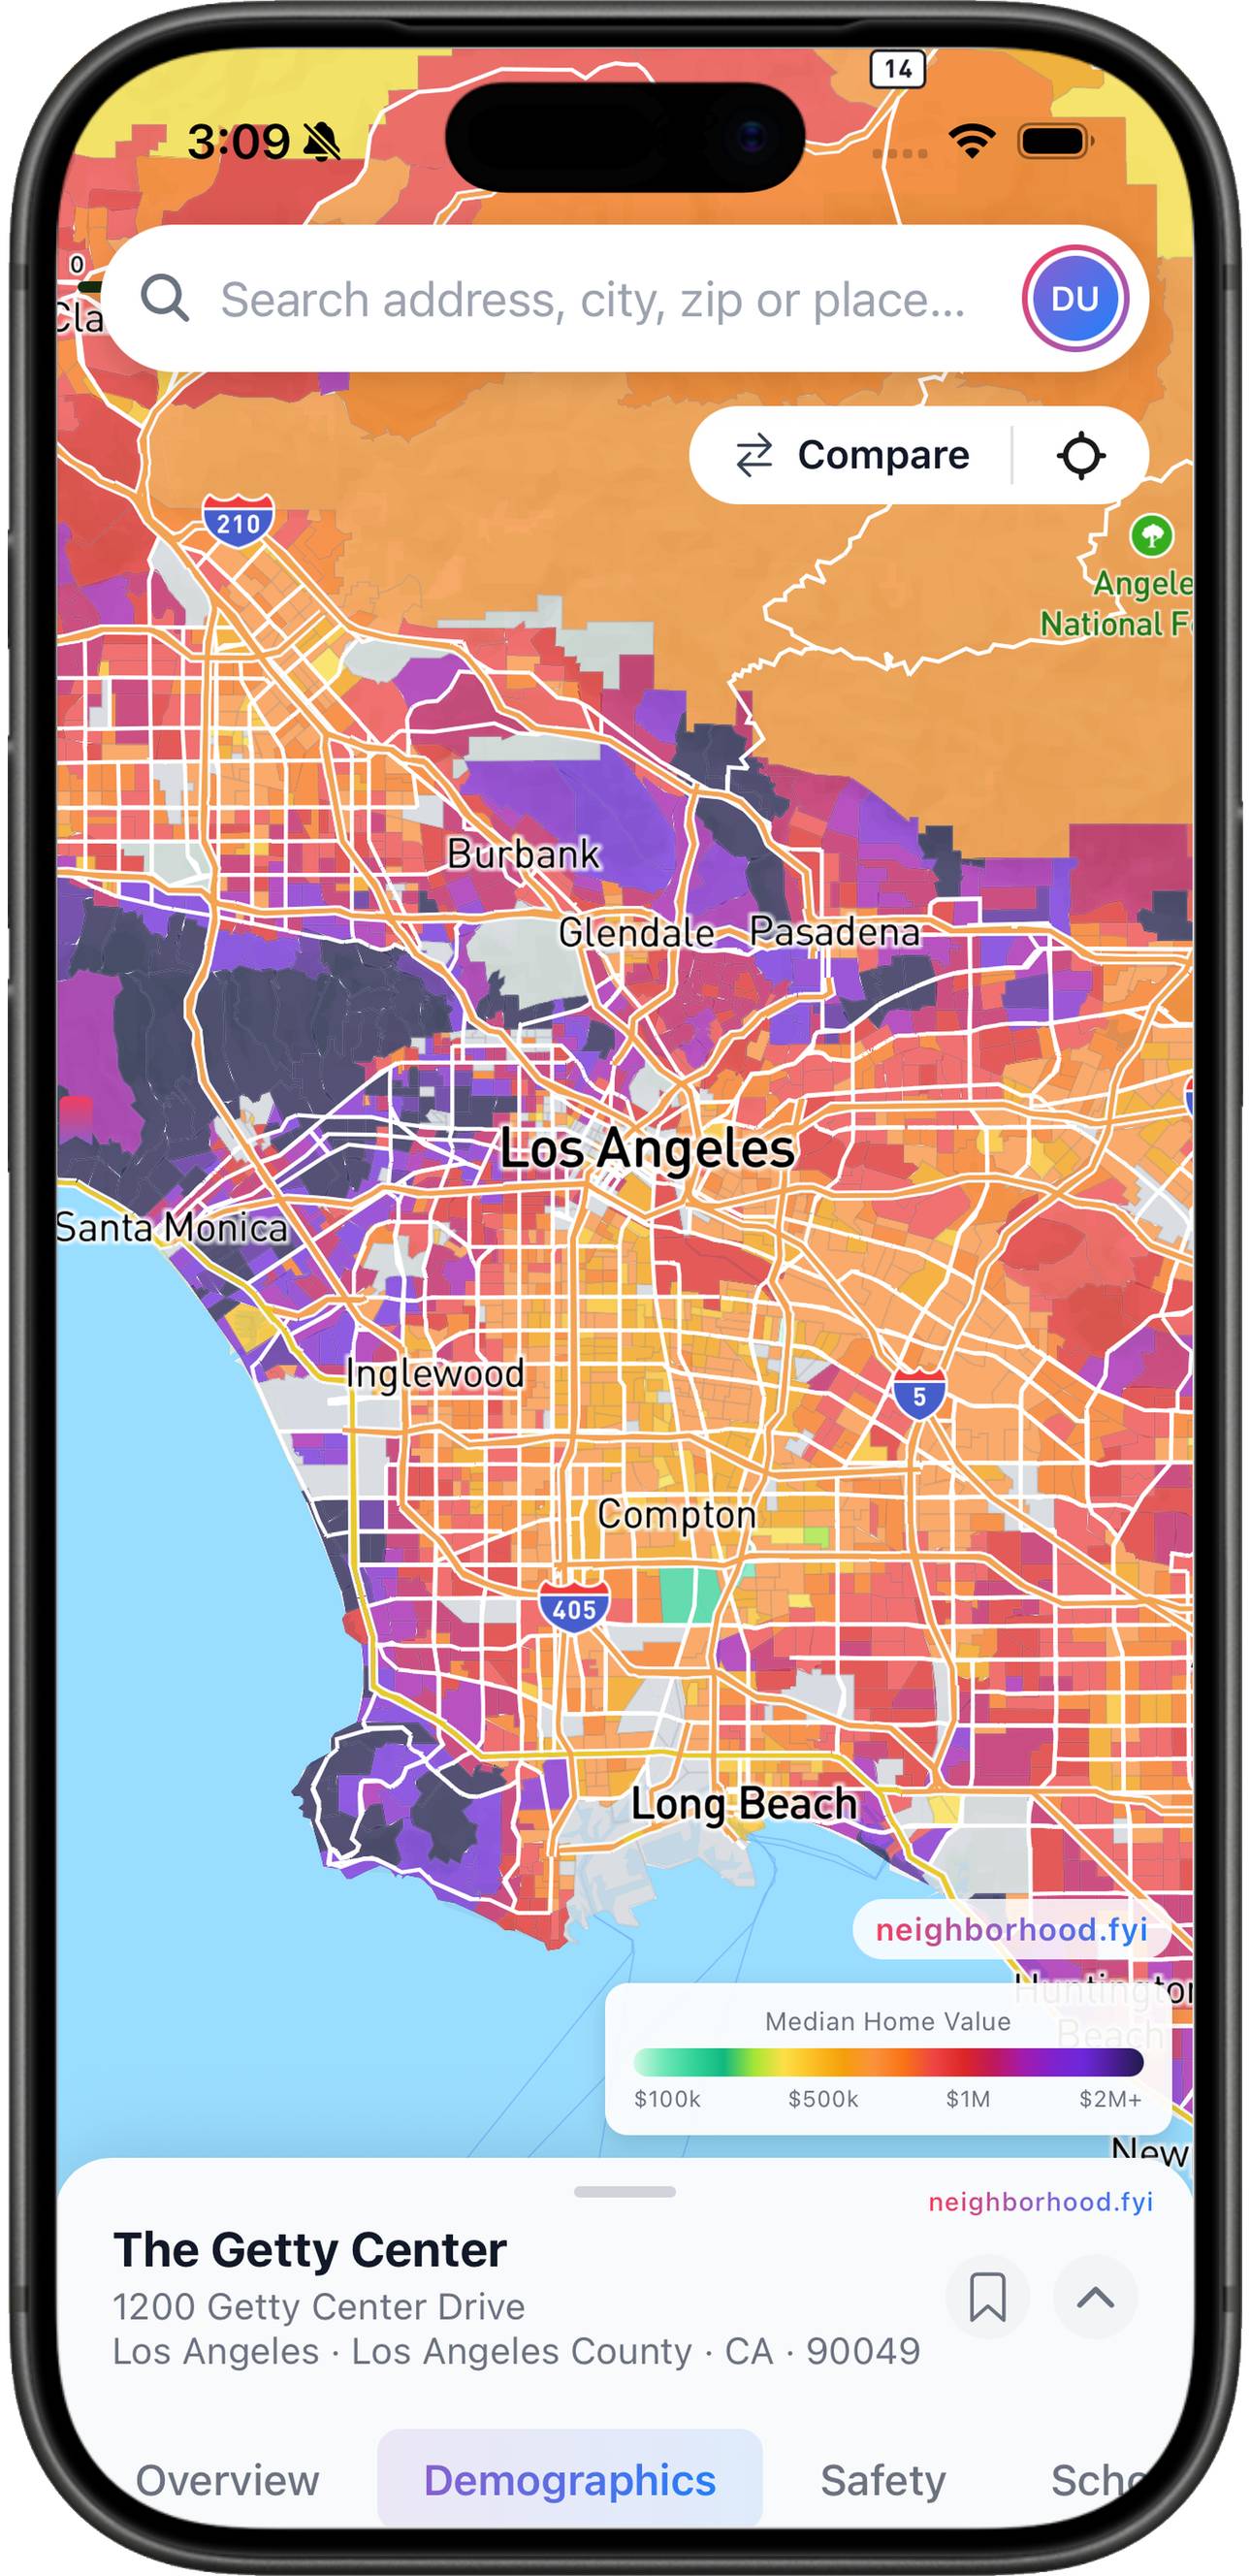
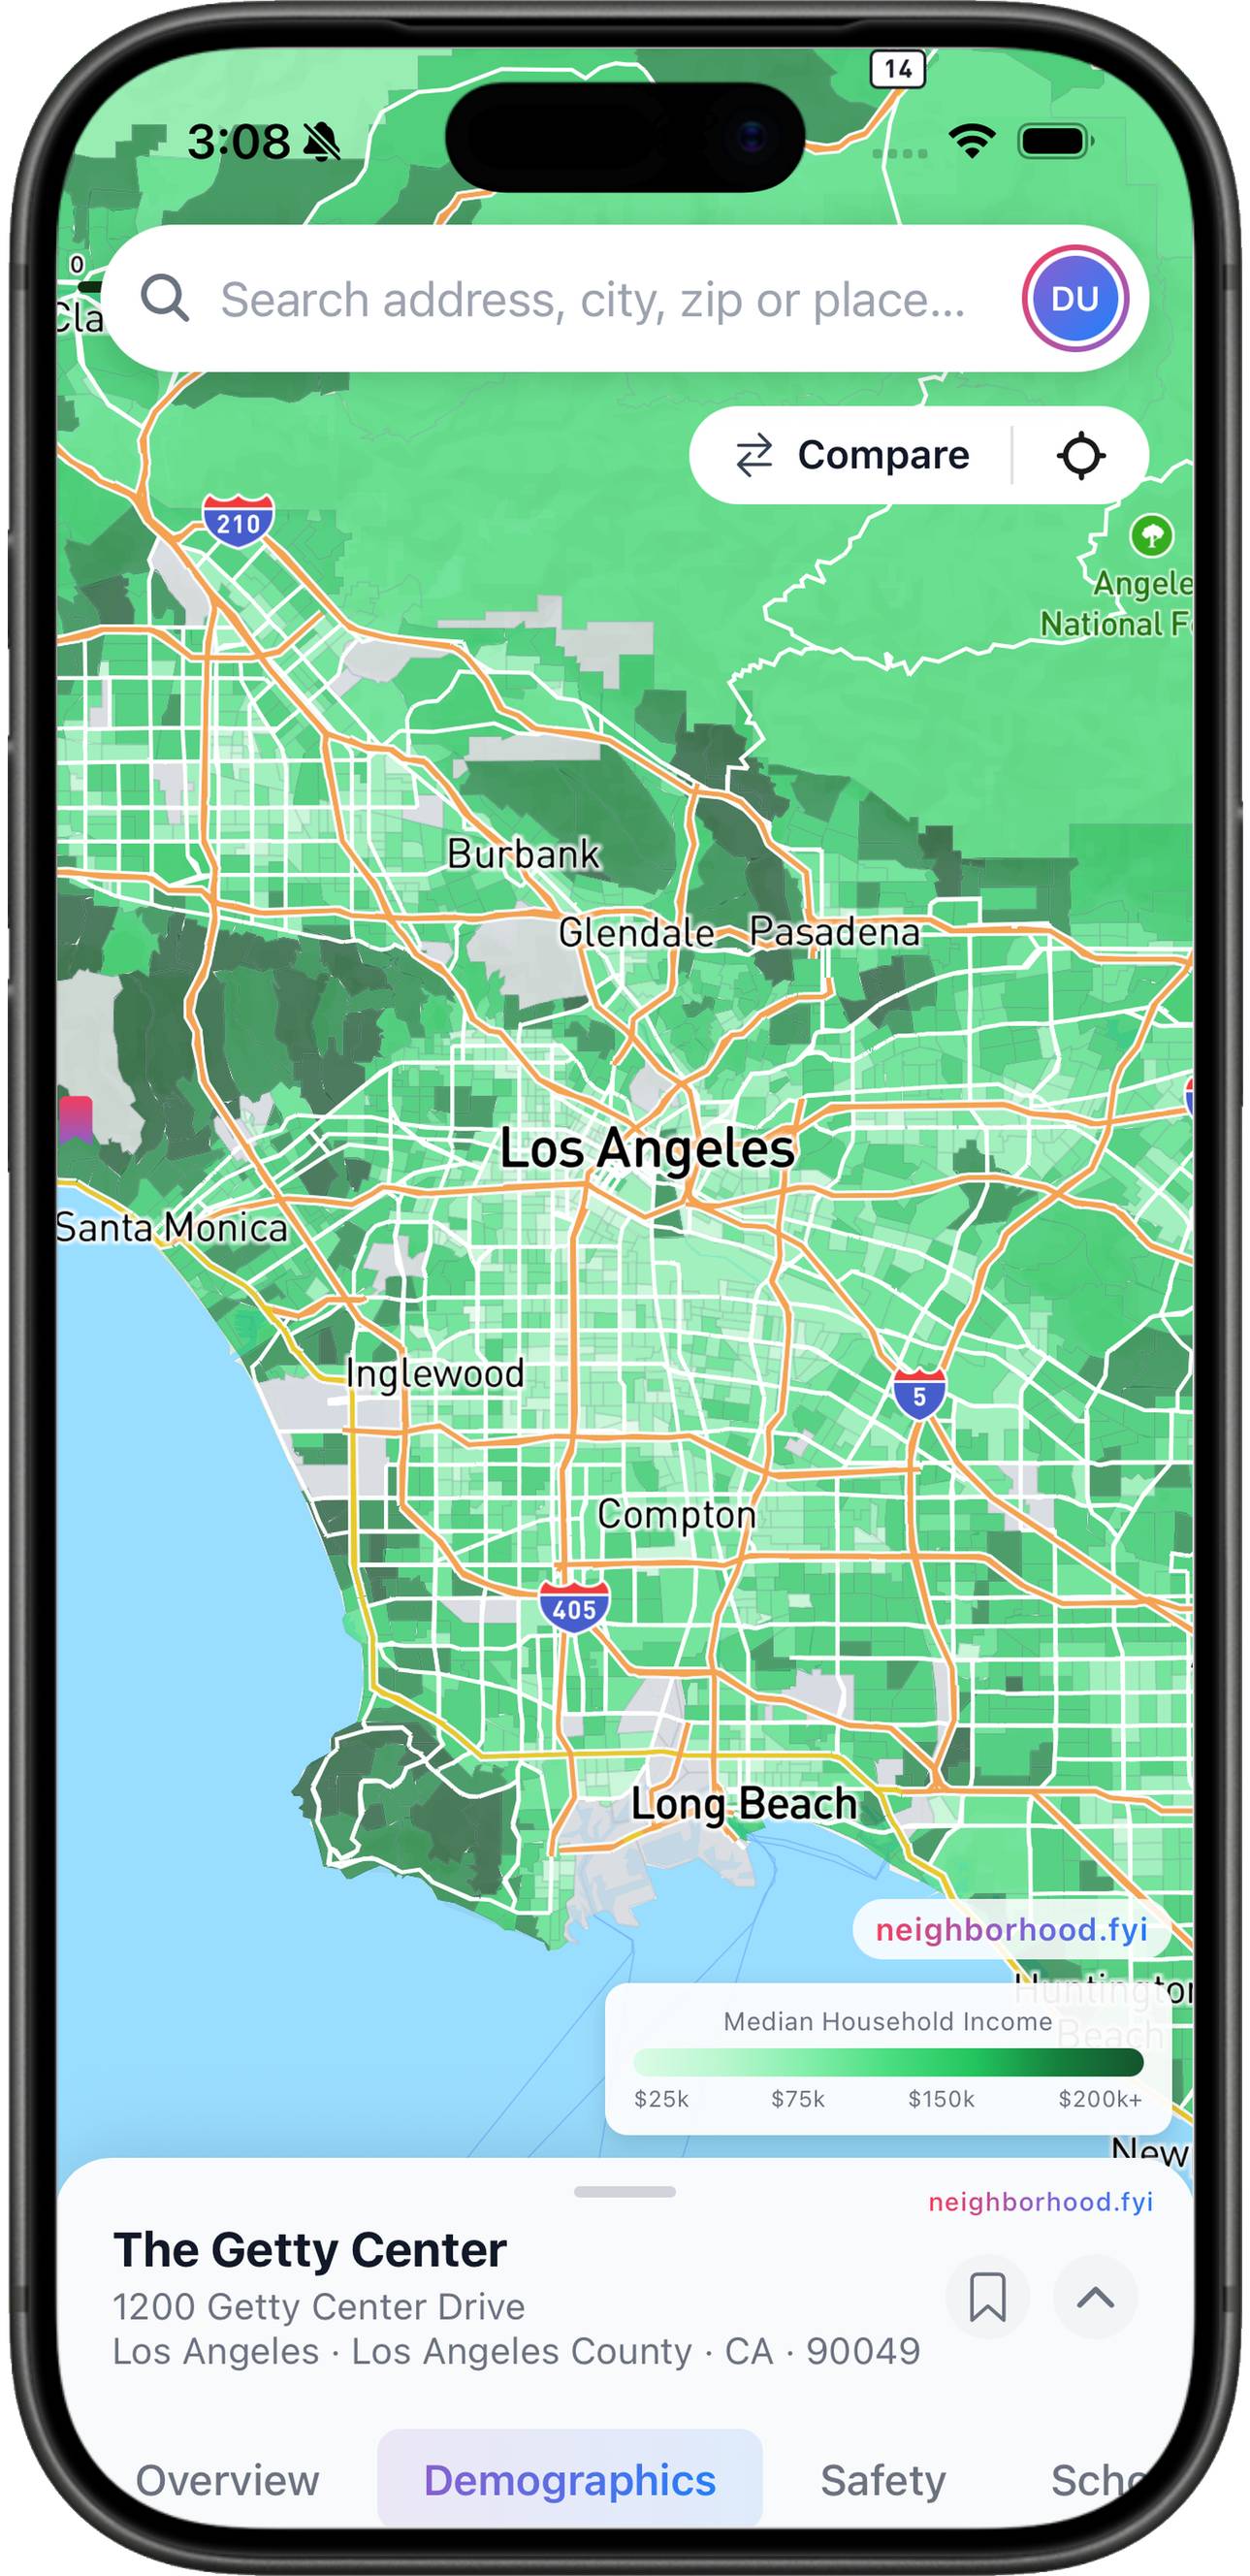
Crime rates, offender registries, and safety scores — surfaced instantly for any address. Don't rely on vibes. Rely on data.
- Violent & property crime rates with national comparisons
- Registered sex offenders mapped within a 2-mile radius
- Full offender profiles: offense type, registration status, photo